Field Notes
<--2015-09-30 12:00:00 | 2015-10-29 11:30:00-->Other sites visited today: Mayberry | Twitchell Rice | East End | West Pond
Phenocam link: Searching...
Twitchell Alfalfa: 2015-10-15 12:30:00 (DOY 288)
Author: Joe Verfaillie
Others: Patty, Ian
Summary: Western half of field mowed, Installed diffuse PAR sensor, spliced SHF 3, Patty did soil respiration
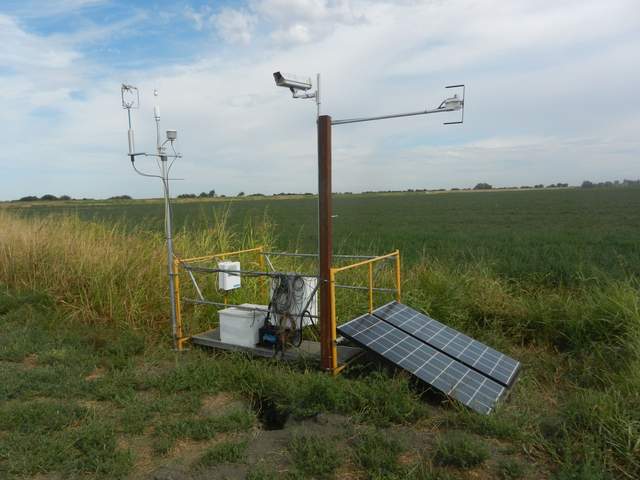
| Alfalfa 2015-10-15 I arrived about 12:30 with Patty and Ian. The western half of the field has been mowed and one pass along the edges including in front of our tower. The squirrels are still active but didn’t burry or damage anything more. I installed a rotating shadow band diffuse PAR sensor sn 040411. The sensor is bolted to the 4x4 that holds the camera and points to the south over the edge of the solar panels. I collected data from the CR1000 and then uploaded a new program. The new program runs the diffuse PAR sensor in the main scan at 2Hz. The rest of the met data runs in a slow sequence every 10sec. This seems to work, but needs to be watched. The 7500 read: 389.2ppm CO2, 591.5mmol/m3 H2O, 91.6SS, 30.67C, 101.22kPa After cleaning: 96.6SS The 7550 clock was off. At 12:11 I reset it from 12:06 The 7550 bandwidth setting was 5Hz, I changed it to 10Hz since we are running at 20Hz. Patty did soil respiration with a motorcycle battery to run the 6400. Soil respiration was 3.5 – 5.5 umol/m2/s I spliced heat flux #3 cable where the squirrels had chewed it several weeks ago. It was reading 1.29mV afterwards. |
3 photos found

20151015TA_DiffusePAR.jpg ( 2015-10-15 13:34:16 ) Full size: 1920x1440
Newly installed diffuse PAR sensor with homemade rotating shadow band

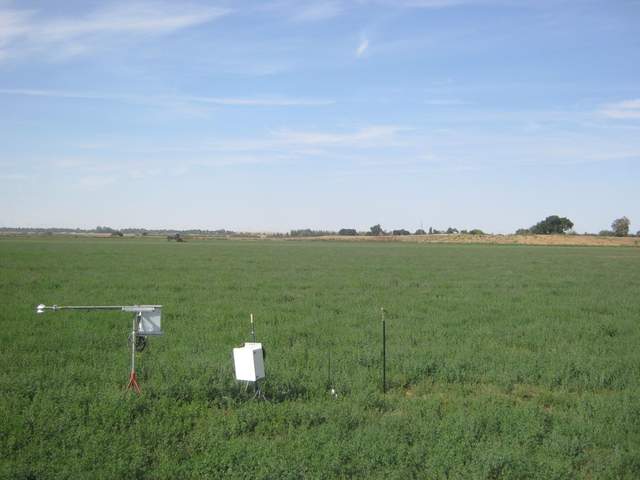
TA_autocam_20151014_1115.jpg ( 2015-10-14 11:15:02 ) Full size: 1920x1440
Start of mowing

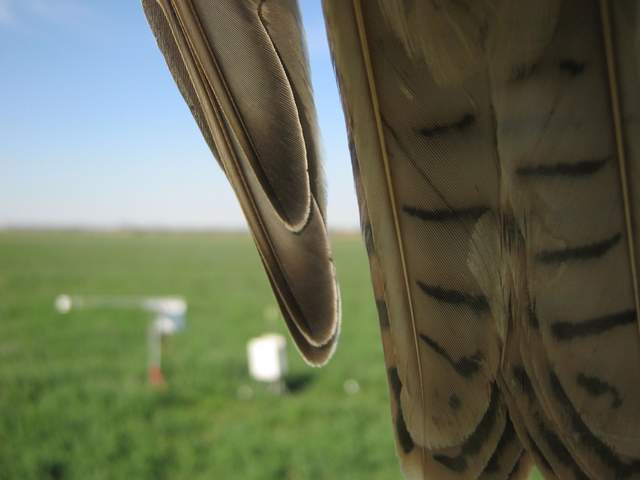
TA_autocam_20151016_0945.jpg ( 2015-10-16 09:45:02 ) Full size: 1920x1440
Hawk on camera
7 sets found
Can't check TA_met
11 TA_met graphs found
Can't check TA_rad
3 TA_rad graphs found
Can't check TA_flux
5 TA_flux graphs found
Can't check TA_soilco2
7 TA_soilco2 graphs found
No data found for TA_arable.
1 TA_cam graphs found
Can't check TATWBABCSB_cam

