Field Notes
<--2015-08-06 10:30:00 | 2015-09-02 10:00:00-->Other sites visited today: Mayberry | Twitchell Rice | East End | West Pond
Phenocam link: Searching...
Twitchell Alfalfa: 2015-08-19 13:00:00 (DOY 231)
Author: Joe Verfaillie
Others: Patty
Summary: Lots of butterflies, fixed wiring on Forerunner probes, swapped 8cm probe.
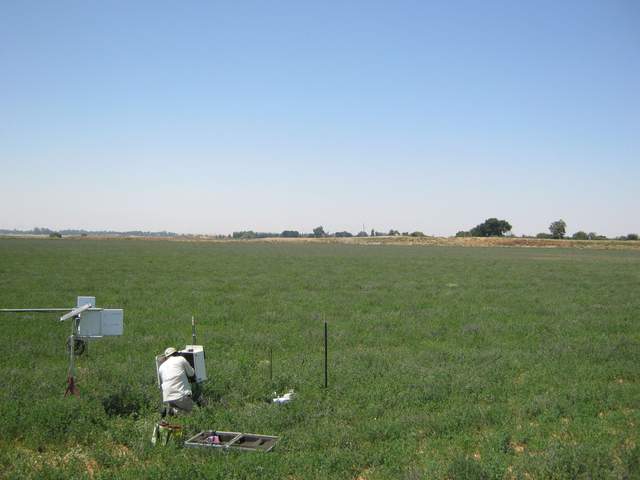
| Alfalfa 2015-08-19 I arrived about 1pm with Patty. It was clear, sunny and hot with a breeze from the west. There were lots and lots of yellow butterflies in the field. The field to the south has been mowed and baled. It looked like they were spraying that field with fertilizer. Our field is flowering. The 7500 read: 389ppm CO2, 647mmol/m3 H2O, 95.0SS, 26.67C, 101.15kPa I swapped the gray and purple wires on Forerunner probes 2 and 3. I also swapped out probe 2 (8cm). The ground was very dry and crumbly so I don’t think it made a good seal with the probe. I pulled sn GP2013ex03 (3%) out and sn GP20140026 (2%) went in. Patty said the 8cm data has been dropping out occasionally. Patty did soil respiration, spectral and veg height. I pulled grass around the solar panels and scaffolding. I also washed the solar panels. |
Veg Height (cm): Tape measure from ground to top of plant
45, 40, 40, 25, 13, 30, 15, 36, 40, 30, 25, 40, 18, 20, 42, 30, 40, 35, 35, 30, avg = 31.5, stdev = 9.52
1 photos found

TA_autocam_20150819_1215.jpg ( 2015-08-19 12:15:02 ) Full size: 1920x1440
Joe on site
7 sets found
Can't check TA_met
11 TA_met graphs found
Can't check TA_rad
3 TA_rad graphs found
Can't check TA_flux
5 TA_flux graphs found
Can't check TA_soilco2
7 TA_soilco2 graphs found
No data found for TA_arable.
1 TA_cam graphs found
Can't check TATWBABCSB_cam

