
Field Notes
<--2015-08-19 13:00:00 | 2015-09-16 12:00:00-->Other sites visited today: Mayberry | Twitchell Rice | East End | West Pond
Phenocam link: Searching...
Twitchell Alfalfa: 2015-09-02 10:00:00 (DOY 245)
Author: Joe Verfaillie
Others: Sara, Kyle
Summary: Field half mowed, squirrels causing trouble, full data collection including clip plots.
| Alfalfa 2015-09-02 I arrived about 10am with Sara and Kyle. The western half of the field and one pass along the edge of the field past the tower has been mowed. We cut the area around the soil and radiation sensors anticipating the rest getting mowed. There was water in the bottom of the ditch to the south of our field. Squirrels are active around the tower again. The corner of the solar panels was buried, the power line for the LI-6400 was chewed and SHF plate #3 was not working – probably chewed. The LI-6400 power line worked, but I cut it off and put a connector at the tower. I will replace it and carry it with the 6400 from now on. The ground sensors should probably all be dug up and reset this winter when the ground is wet. I can try finding and splicing the break in SFH plate #3 next time. The 7500 read: 393.7ppm CO2, 591.7mmol/m3, 96.0SS, 24.7C, 101.1kPa Sara did spectral measurements and clip plots, and Kyle did veg height and soil respiration. There was a helicopter bringing in bundles of green, leafy material along the levee just north of the field. It was a collection operation for illegal marijuana from the surrounding area. |
Veg Height (cm): Tape measure from ground to top of plant
54, 32, 38, 43, 34, 33, 50, 47, 51, 30, 41, 42, 41, 39, 55, 40, 42, 44, 32, 33, avg = 41.1, stdev = 7.51
3 photos found

20150902TA_CollectingMJ.jpg ( 2015-09-02 10:06:32 ) Full size: 1920x1440
Helicopter removing stacks of marijuana from the corn fields
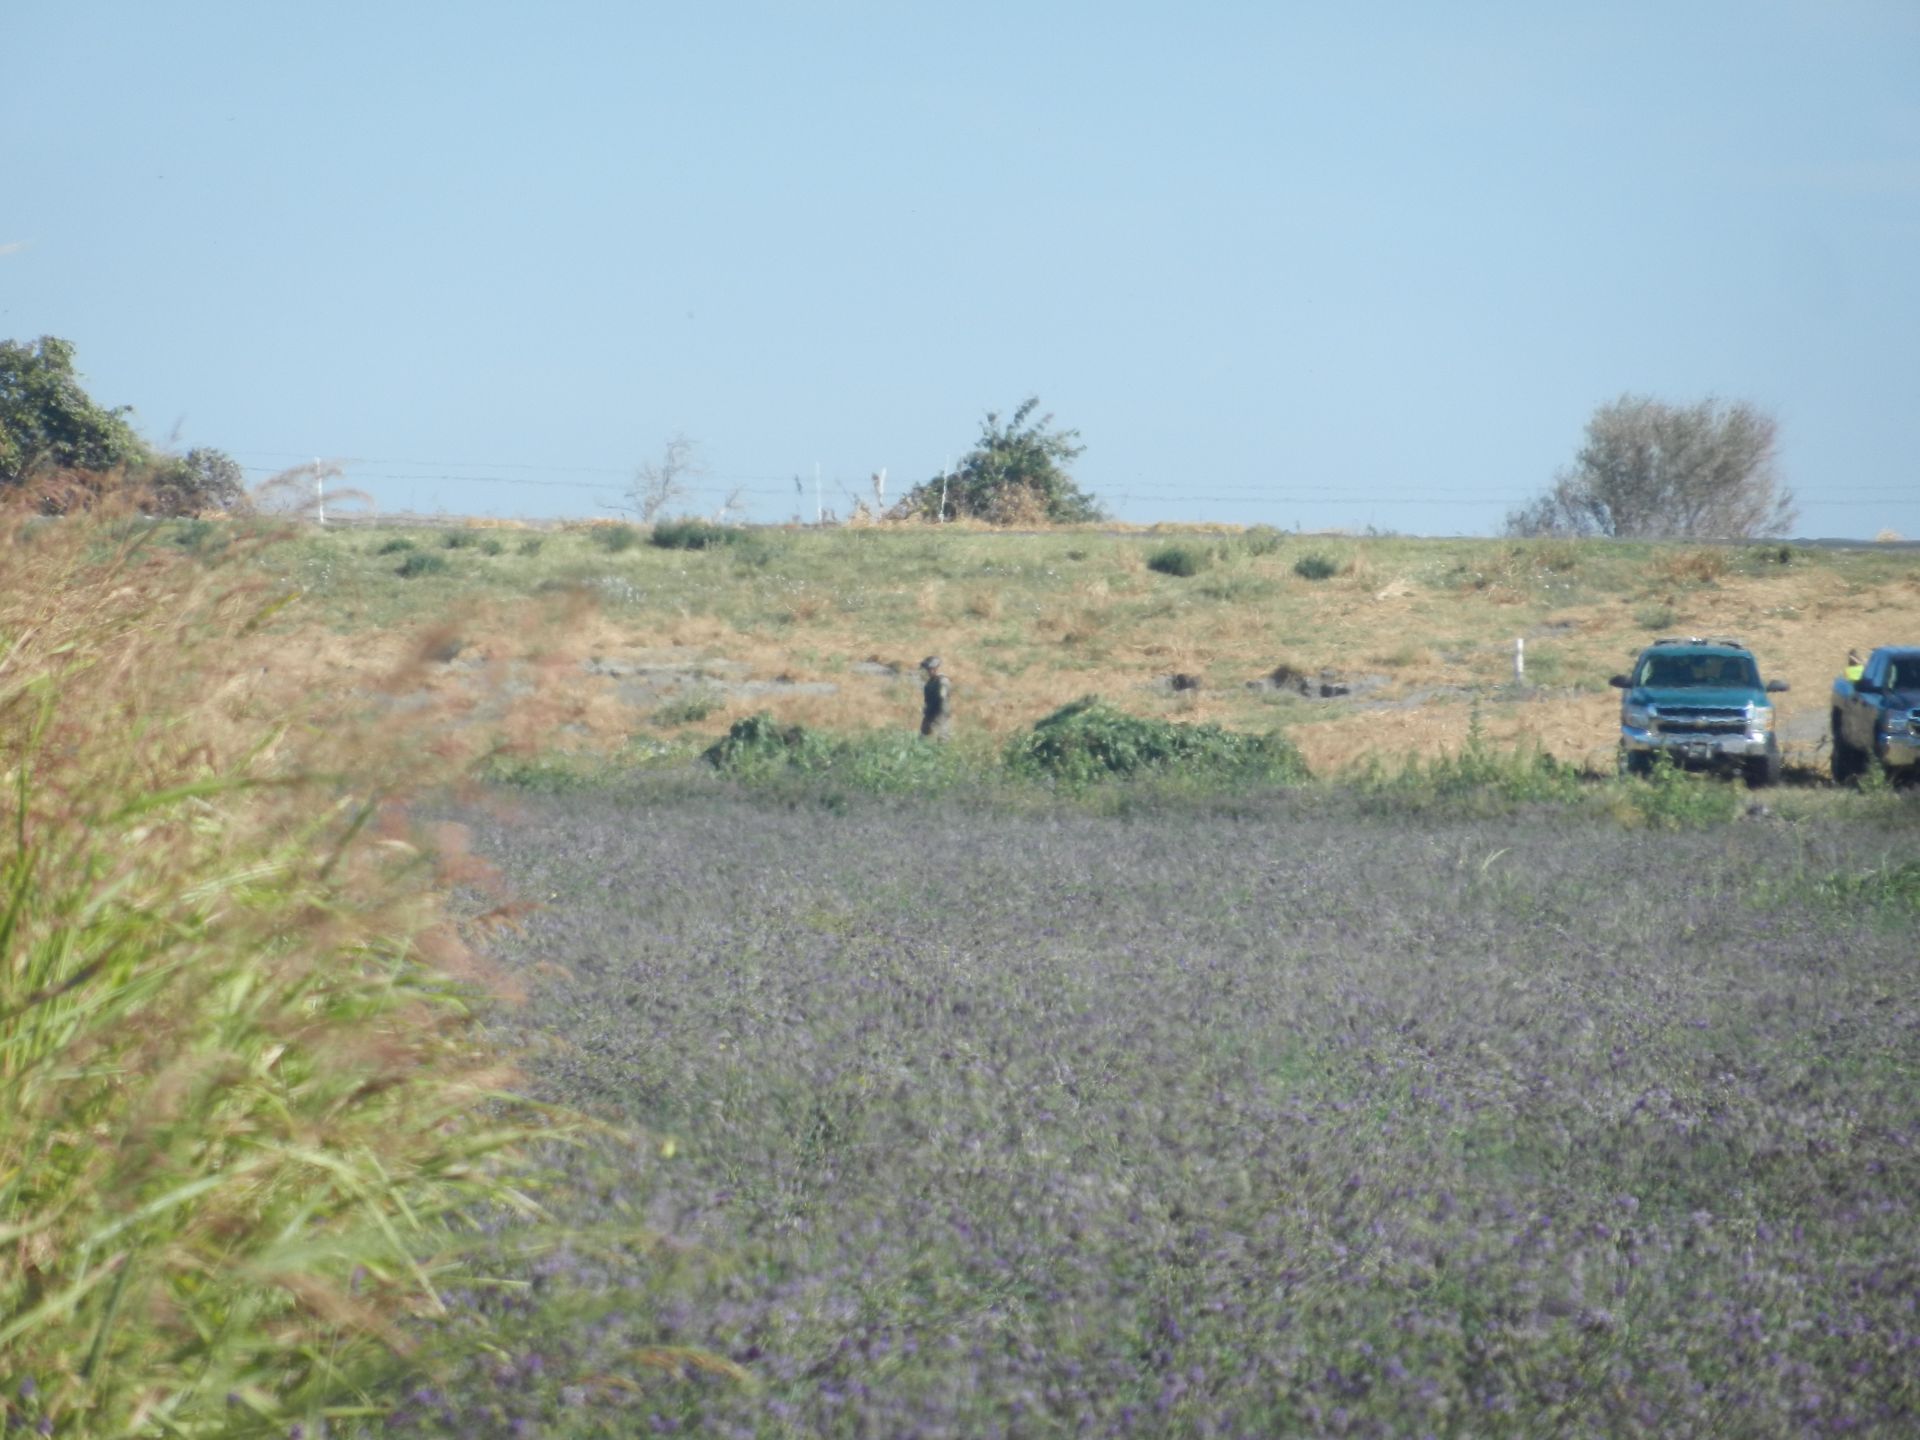
20150902TA_PilesOfMJ.jpg ( 2015-09-02 10:08:52 ) Full size: 1920x1440
DEA collecting marijuana to burn

TA_autocam_20150902_0945.jpg ( 2015-09-02 09:45:02 ) Full size: 1920x1440
Joe, Kyle, Sara on site
7 sets found
Can't check TA_met
11 TA_met graphs found
Can't check TA_rad
3 TA_rad graphs found
Can't check TA_flux
5 TA_flux graphs found
Can't check TA_soilco2
7 TA_soilco2 graphs found
No data found for TA_arable.
1 TA_cam graphs found
Can't check TATWBABCSB_cam