
Field Notes
<--2014-12-09 11:00:00 | 2015-01-07 10:00:00-->Other sites visited today: Twitchell Rice | Twitchell Alfalfa | West Pond | Mayberry | East End | Sherman Island
Phenocam link: Searching...
Tonzi: 2014-12-23 09:00:00 (DOY 357)
Author: Siyan Ma
Others:
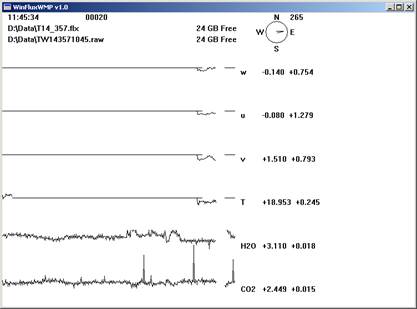
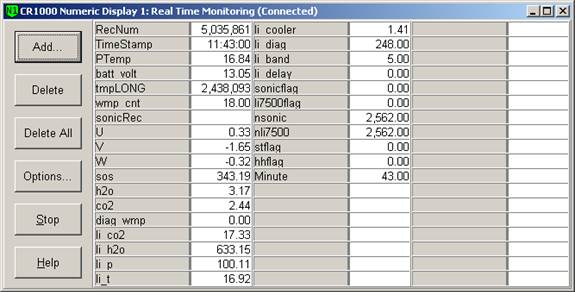
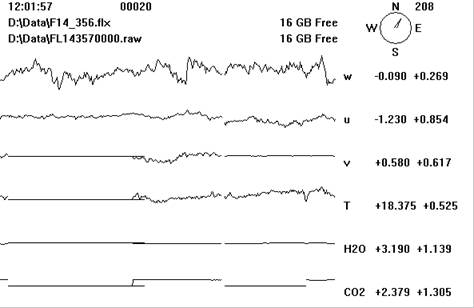
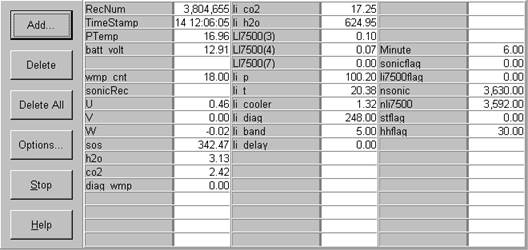
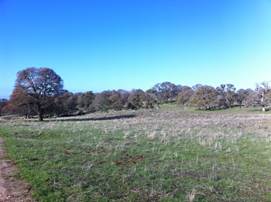
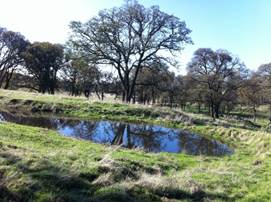
Summary: Ponds are full, swapped 7500s at Tonzi, Brought in LI-820, Tower sonic hung up again.
|
When: Date: 12/23/2014 , Day: 162 , Watch Time: 9:00 am . Where: Tonzi/Vaira Ranch Who: Siyan Weather: clear, sunny Phenology: ponds full
Summary
Vaira_Grass Site
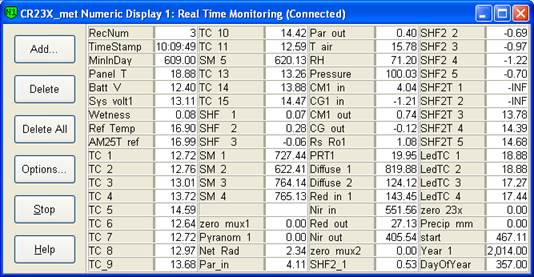 
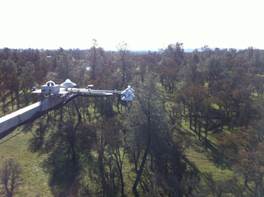
Tonzi_Tower Site
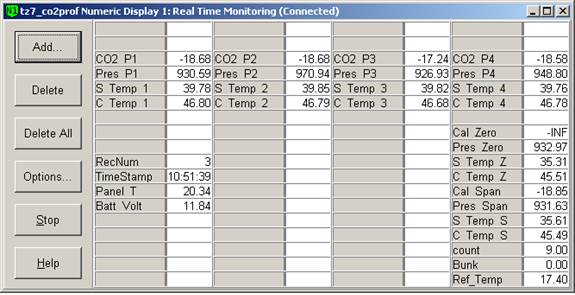 
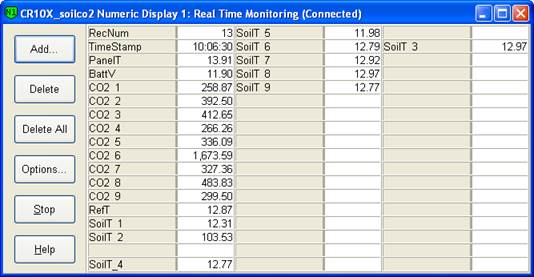
The CO2 profile system wasn’t calibrated on site due to failure of IRGA. Turn off co2profile, take home IRGA. 10. closed gate and set up fence. YES! Toniz_Floor Site
CR23X3 – floor-Met CR23X6 – tower-Met CR10X2 – floor-Met Soil CO2 profile: CR23X5 – soil CO2 profile 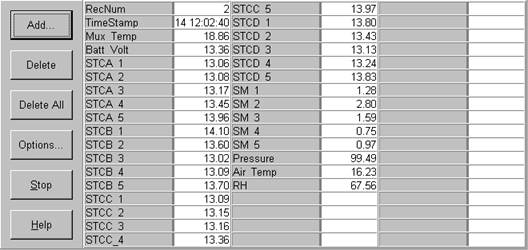 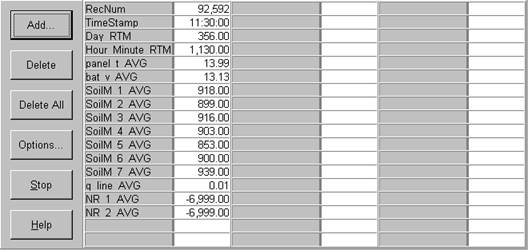 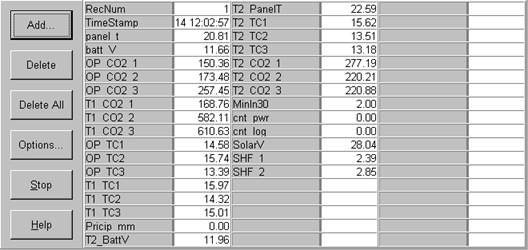 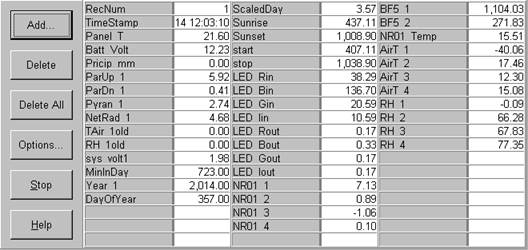
|
Field Data
No tank data
Well Depth
| Date | Location | Depth (feet) |
|---|---|---|
| 2014-12-23 | TZ_floor | 32 |
| 2014-12-23 | TZ_road | 38.8 |
| 2014-12-23 | TZ_tower | 36.7 |
mode = both
Moisture Point Probes TZ
Array
(
[0] => Tower_1
[1] => Floor_South_1
[2] => Floor_East_1
[3] => Floor_West_1
[4] => SoilCO2_1
[5] => Soil_Transect_4_1
[6] => Soil_Transect_3_1
[7] => Soil_Transect_2_1
[8] => Soil_Transect_1_1
[9] => SoilCO2_West_A_1
[10] => SoilCO2_West_B_1
[11] => SoilCO2_West_C_1
[12] => Tower_2
[13] => Floor_South_2
[14] => Floor_East_2
[15] => Floor_West_2
[16] => SoilCO2_2
[17] => Soil_Transect_4_2
[18] => Soil_Transect_3_2
[19] => Soil_Transect_2_2
[20] => Soil_Transect_1_2
[21] => SoilCO2_West_A_2
[22] => SoilCO2_West_B_2
[23] => SoilCO2_West_C_2
[24] => Tower_3
[25] => Floor_South_3
[26] => Floor_East_3
[27] => Floor_West_3
[28] => SoilCO2_3
[29] => Soil_Transect_4_3
[30] => Soil_Transect_3_3
[31] => Soil_Transect_2_3
[32] => Soil_Transect_1_3
[33] => SoilCO2_West_A_3
[34] => SoilCO2_West_B_3
[35] => SoilCO2_West_C_3
[36] => Tower_4
[37] => Floor_South_4
[38] => Floor_East_4
[39] => Floor_West_4
[40] => SoilCO2_4
[41] => Soil_Transect_4_4
[42] => Soil_Transect_3_4
[43] => Soil_Transect_2_4
[44] => Soil_Transect_1_4
[45] => SoilCO2_West_A_4
[46] => SoilCO2_West_B_4
[47] => SoilCO2_West_C_4
)
| Date | DOY | Rep | Depth | Tower_1 |
Floor_South_1 |
Floor_East_1 |
Floor_West_1 |
SoilCO2_1 |
Soil_Transect_4_1 |
Soil_Transect_3_1 |
Soil_Transect_2_1 |
Soil_Transect_1_1 |
SoilCO2_West_A_1 |
SoilCO2_West_B_1 |
SoilCO2_West_C_1 |
Tower_2 |
Floor_South_2 |
Floor_East_2 |
Floor_West_2 |
SoilCO2_2 |
Soil_Transect_4_2 |
Soil_Transect_3_2 |
Soil_Transect_2_2 |
Soil_Transect_1_2 |
SoilCO2_West_A_2 |
SoilCO2_West_B_2 |
SoilCO2_West_C_2 |
Tower_3 |
Floor_South_3 |
Floor_East_3 |
Floor_West_3 |
SoilCO2_3 |
Soil_Transect_4_3 |
Soil_Transect_3_3 |
Soil_Transect_2_3 |
Soil_Transect_1_3 |
SoilCO2_West_A_3 |
SoilCO2_West_B_3 |
SoilCO2_West_C_3 |
Tower_4 |
Floor_South_4 |
Floor_East_4 |
Floor_West_4 |
SoilCO2_4 |
Soil_Transect_4_4 |
Soil_Transect_3_4 |
Soil_Transect_2_4 |
Soil_Transect_1_4 |
SoilCO2_West_A_4 |
SoilCO2_West_B_4 |
SoilCO2_West_C_4 |
Avg | Spacial Count |
Measurement Count |
|---|---|---|---|---|---|---|---|---|---|---|---|---|---|---|---|---|---|---|---|---|---|---|---|---|---|---|---|---|---|---|---|---|---|---|---|---|---|---|---|---|---|---|---|---|---|---|---|---|---|---|---|---|---|---|
| 2014-12-23 | 357 | 0 | nan | 41.4 | 26.7 | 47.5 | 38.2 | 35.5 | 27 | 22.9 | 24.1 | 25 | 30.2 | 22.9 | 32 | 35.3 | 55.5 | 37.4 | 38.7 | 33.2 | 37.8 | 35.3 | 35.9 | 29.8 | 29.8 | 27.1 | 36.5 | 39.6 | 57.1 | 38 | 42.7 | 39.9 | 35.4 | 40.7 | 35.2 | 38.5 | 38.2 | 36.8 | 44.9 | 41.4 | 42.8 | 61.5 | 61.7 | 43.1 | 35.4 | 40.8 | 47.1 | 40 | 44 | 51.1 | 45.7 | |||
| 2014-12-23 | 357 | 1 | nan | 41.7 | 35.9 | 39.9 | 41.4 | |||||||||||||||||||||||||||||||||||||||||||||||
| 2014-12-23 | 357 | Avg | 0-15cm | 0 | 0 | |||||||||||||||||||||||||||||||||||||||||||||||||
| 2014-12-23 | 357 | Avg | 15-30cm | 0 | 0 | |||||||||||||||||||||||||||||||||||||||||||||||||
| 2014-12-23 | 357 | Avg | 30-45cm | 0 | 0 | |||||||||||||||||||||||||||||||||||||||||||||||||
| 2014-12-23 | 357 | Avg | 45-60cm | 0 | 0 |
mode = both
Moisture Point Probes VR
Array
(
[0] => Solar_Panels_1
[1] => Flux_Tower_1
[2] => Gate_1
[3] => Biomass_Cage_1
[4] => Solar_Panels_2
[5] => Flux_Tower_2
[6] => Gate_2
[7] => Biomass_Cage_2
[8] => Solar_Panels_3
[9] => Flux_Tower_3
[10] => Gate_3
[11] => Biomass_Cage_3
[12] => Solar_Panels_4
[13] => Flux_Tower_4
[14] => Gate_4
[15] => Biomass_Cage_4
)
| Date | DOY | Rep | Depth | Solar_Panels_1 |
Flux_Tower_1 |
Gate_1 |
Biomass_Cage_1 |
Solar_Panels_2 |
Flux_Tower_2 |
Gate_2 |
Biomass_Cage_2 |
Solar_Panels_3 |
Flux_Tower_3 |
Gate_3 |
Biomass_Cage_3 |
Solar_Panels_4 |
Flux_Tower_4 |
Gate_4 |
Biomass_Cage_4 |
Avg | Spacial Count |
Measurement Count |
|---|---|---|---|---|---|---|---|---|---|---|---|---|---|---|---|---|---|---|---|---|---|---|
| 2014-12-23 | 357 | 0 | nan | 28.2 | 22.9 | 21.4 | 8.3 | 32.3 | 28.3 | 24 | 30.4 | 32.1 | 20.4 | 27.4 | 41 | 44.3 | 27.6 | 23.6 | 33.1 | |||
| 2014-12-23 | 357 | 1 | nan | 27.9 | 24.1 | 21.2 | 8 | 32.3 | 28.6 | 24 | 23.7 | 32.7 | 20.4 | 27.1 | 32.4 | 44 | 31.4 | 24.2 | 33.1 | |||
| 2014-12-23 | 357 | Avg | 0-15cm | 0 | 0 | |||||||||||||||||
| 2014-12-23 | 357 | Avg | 15-30cm | 0 | 0 | |||||||||||||||||
| 2014-12-23 | 357 | Avg | 30-45cm | 0 | 0 | |||||||||||||||||
| 2014-12-23 | 357 | Avg | 45-60cm | 0 | 0 |
No TZ grass heigth found
No VR grass heigth found
Tree DBH
| Date | Tag# | Reading (mm) |
|---|---|---|
| 2014-12-23 | 102 | 10.0 |
| 2014-12-23 | 2 | 13.0 |
| 2014-12-23 | 245 | 20.1 |
| 2014-12-23 | 3 | 13.0 |
| 2014-12-23 | 4 | 9.2 |
| 2014-12-23 | 5 | 12.9 |
| 2014-12-23 | 7 | 10.0 |
| 2014-12-23 | 72 | 19.5 |
| 2014-12-23 | 79 | 15.3 |
| 2014-12-23 | 8 | 13.8 |
No water potential data found
No TZ Grass Biomass data found
No TZ OakLeaves Biomass data found
No TZ PineNeedles Biomass data found
0 photos found
16 sets found
No data found for TZ_Fenergy.
11 TZ_tmet graphs found
11 TZ_soilco2 graphs found
Can't check TZ_mixed
3 TZ_mixed graphs found
1 TZ_fflux graphs found
8 TZ_fmet graphs found
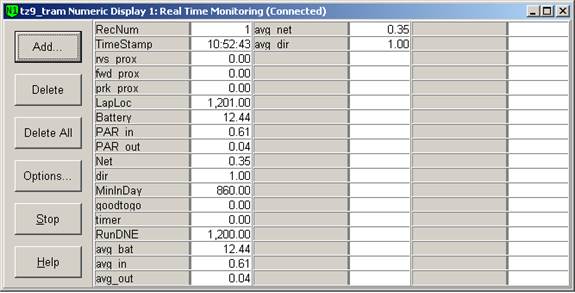
1 TZ_tram graphs found
3 TZ_co2prof graphs found
No data found for TZ_irt.
No data found for TZ_windprof.
1 TZ_tflux graphs found
2 TZ_sm graphs found
Can't check TZ_met
1 TZ_met graphs found
Can't check TZVR_mixed
8 TZ_osu graphs found
No data found for TZ_fd.
Tonzi Z-cam data