
Field Notes
<--2014-09-10 14:00:00 | 2014-09-25 11:00:00-->Other sites visited today: Sherman Island | Twitchell Alfalfa | Twitchell Rice | West Pond | East End
Phenocam link: Searching...
Mayberry: 2014-09-18 09:45:00 (DOY 261)
Author: Joe Verfaillie
Others: Patty
Summary: Portable tower water lower, RefT affixed to logger, cattail fluff beginning.
| Mayberry 2014-09-18 I arrived about 9:45am with Patty. It was warm, humid and still with scattered clouds. The Bay Area was getting some light rain overnight and this morning. Here it looked like there might have been some light rain, but the ground and road surface was largely dry with only the low spots a little damp. Portable tower: The water level was lower again. The water had receded leaving the conductivity probe exposed. I moved it into the water but it is still just barely covered. Looking at the water marks on the cattails, I estimated the water has gone down by about 20inches. Patty downloaded data. The 7700 read: 2.02ppm CH4, 50.6RSSI – 71.0 after cleaning The 7500 read: 16.3mmol/m3 CO2, 844.2mmol/m3 H2O, 101.1kPa, 24.65C, 75.3SS I checked the CR10x. The RefT was lying loose in the box and might have seen some strange heating compared to the PanelT. Probably better to back out the RefT and use the PanelT on previous temperatures. I cable tied the RefT to the panel for the future. Most of the TCs are out of the water and might see high solar load temperatures. I took water samples, but there were only a few inches of water. We saw a family (romp?) of otters – ten or 12 individuals, and a flock of white pelicans. Permanent Tower: All looked well. New caterpillars are munching on the cattails. Cattail fluff is beginning to foul the open paths. The 7700 read: 2.00ppm CH4, 57.4RSSI – 68.5 after cleaning The 7500 read: 403.7ppm CH4, 837.1mmol/m3 H2O, 101.6kPa, 25.3C, 100.6SS Patty took water samples – water level here is normal. |
3 photos found
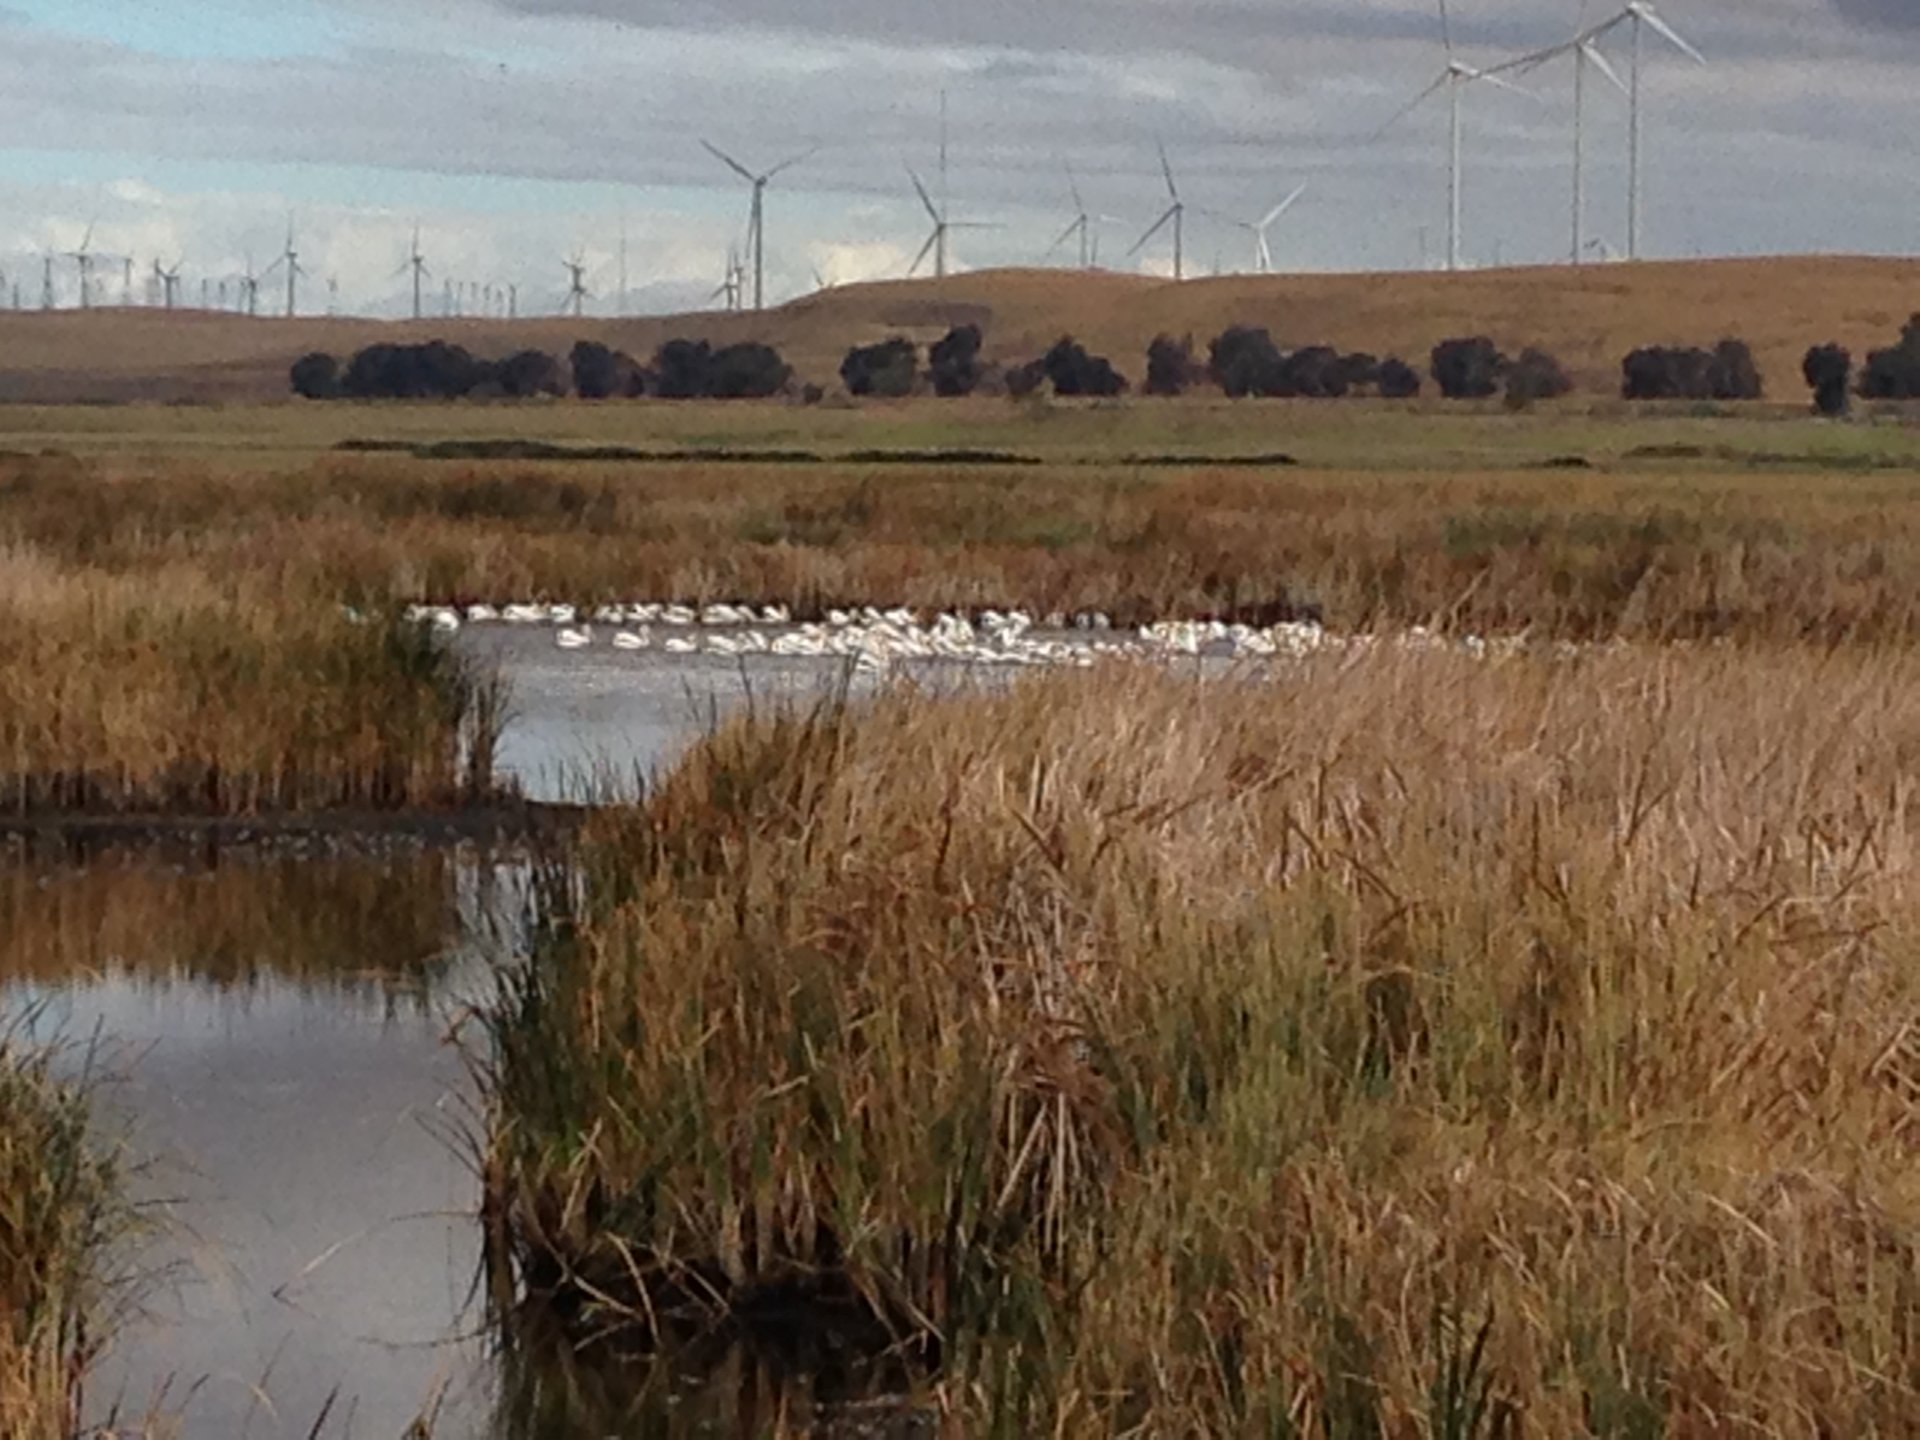
20140918MB_Pelicans.jpg ( 2014-09-18 10:05:56 ) Full size: 1920x1440
A flock of white pelicans in a pond among brown wetland reeds
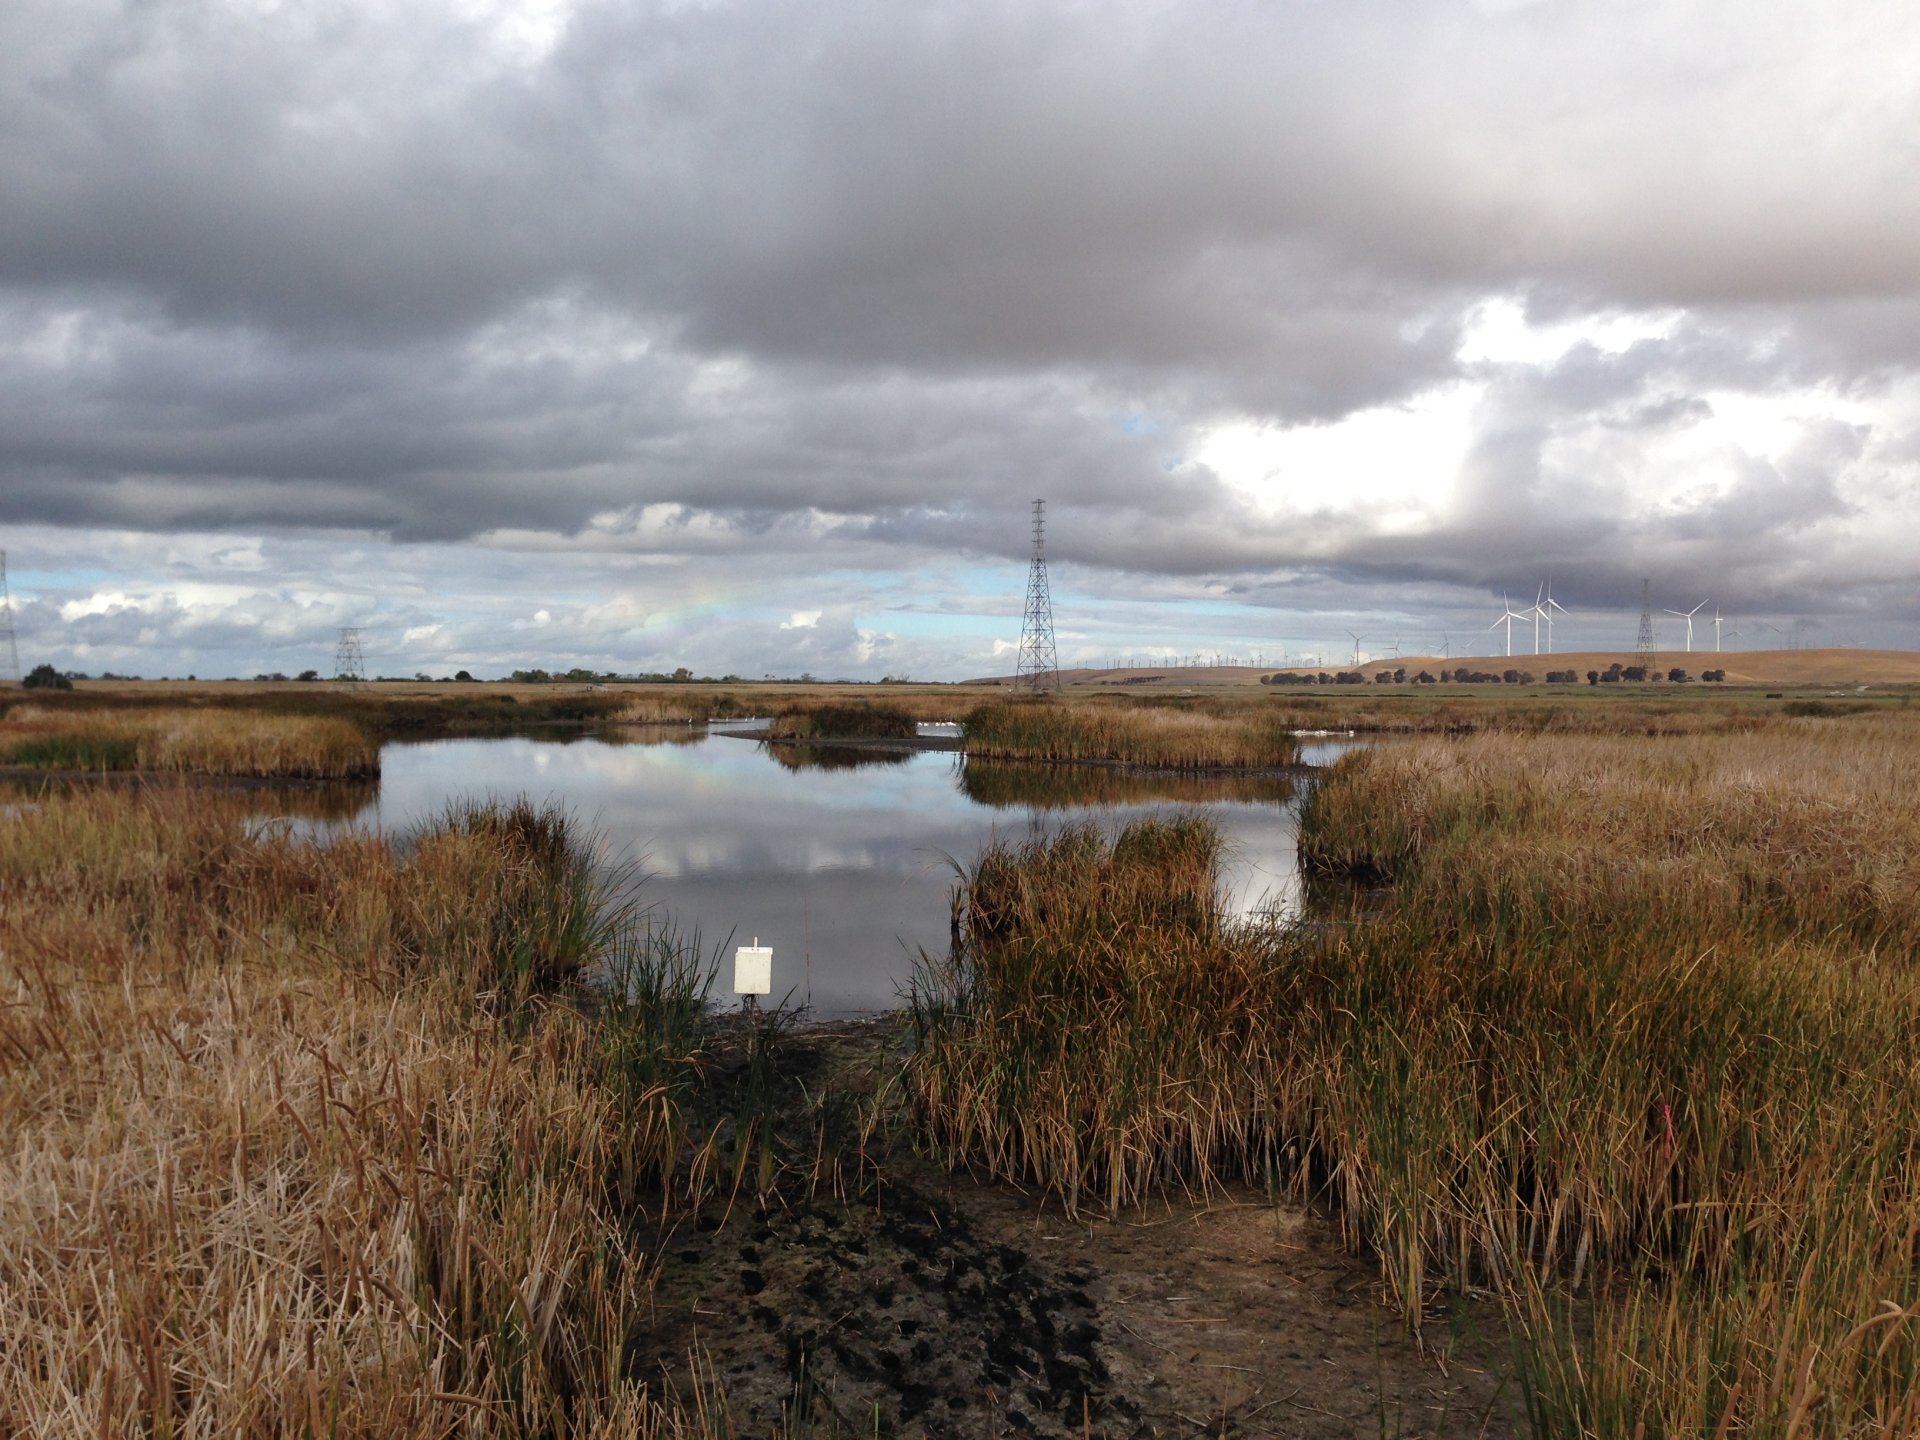
20140918MB_LowWater.jpg ( 2014-09-18 10:04:28 ) Full size: 1920x1440
Low water level and a vague rainbow in the sky
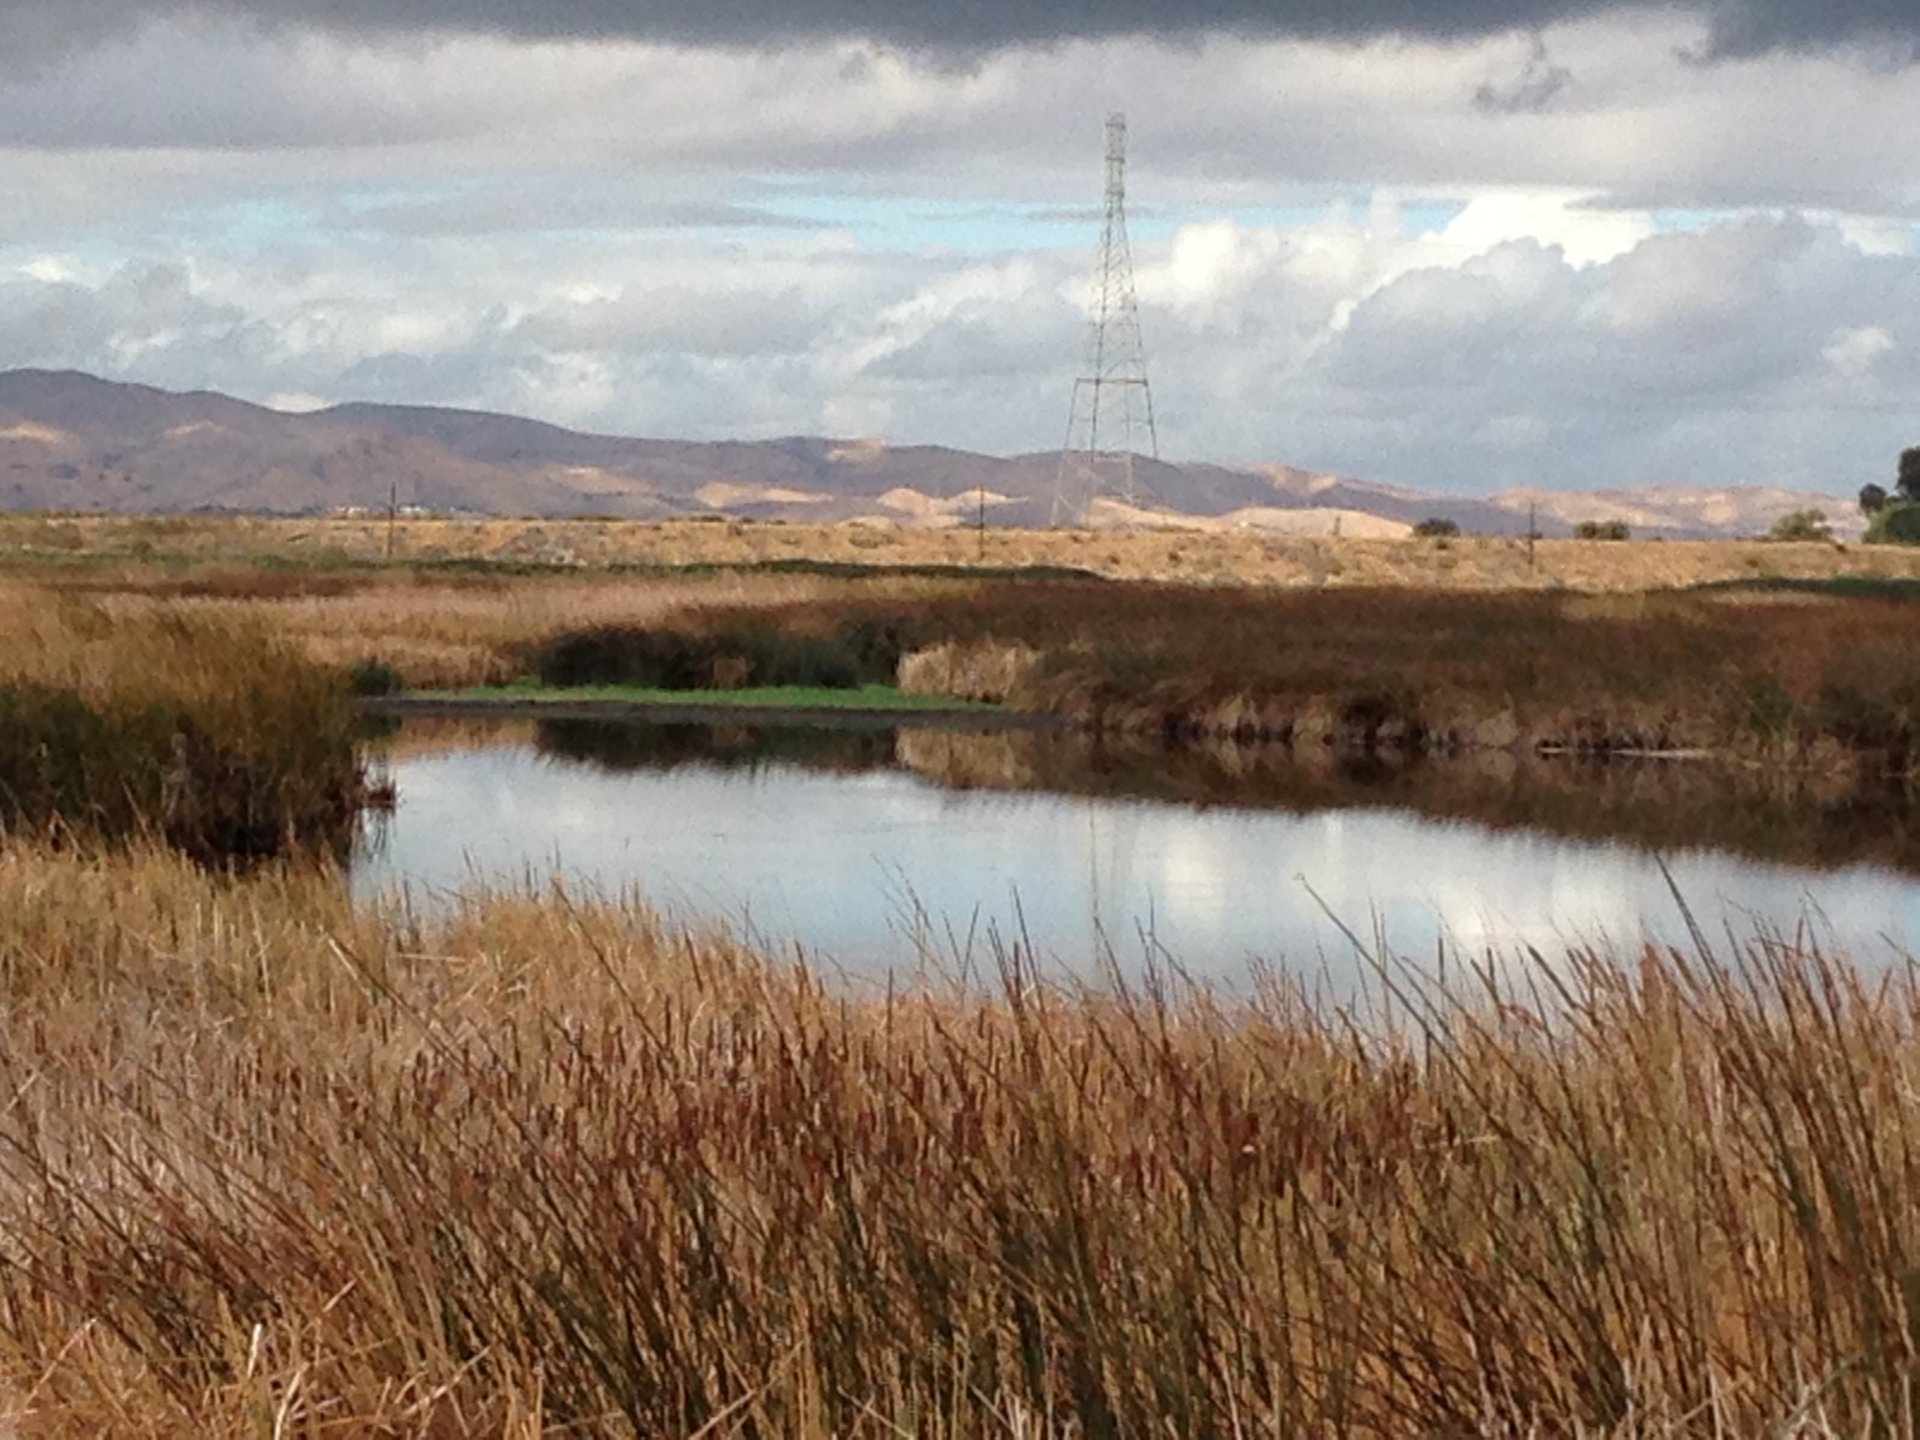
20140918MB_NewGrowth.jpg ( 2014-09-18 10:06:38 ) Full size: 1920x1440
Bright green new growth on near the water's surface at the edge of the wetland
11 sets found
7 MB_flux graphs found
No data found for MB_met.
28 MB_tule graphs found
Can't check MBWPEESWGT_mixed
1 MB_cam graphs found
Can't check MBEEWPSWEPGT_cam
Can't check SIMBTWEE_met
No data found for MB_minidot.
Can't check MBSWEEWPBCBA
1 MB_processed graphs found
Can't check MB_fd
1 MB_fd graphs found