
Field Notes
<--2014-07-31 09:10:00 | 2014-08-13 15:00:00-->Other sites visited today: Mayberry | Twitchell Rice | East End | West Pond | Twitchell Alfalfa
Phenocam link: Searching...
Sherman Island: 2014-08-07 09:00:00 (DOY 219)
Author: Cove Sturtevant
Others: Sara
Summary: Met folks from Estonia at site. Data download. Regular fieldwork. Removed soil Co2 system.
| Sherman 2014-08-07 We arrived around 09:00 PDT, meeting Kuno and Kaido from Estonia who were looking to take some soil respiration measurements in drained peat. It was sunny, breezy, and warm. The site is unchanged. I downloaded data and did well depth while Sara did veg height, moisture point, and spectral. We then removed the entire soil CO2 system to place at Alfalfa next week. LGR readings: 1.90 ppm, 09:19, 22.7 C, 146.3 Torr, 14.70 us, 10 Hz 7500 readings: CO2: 15.8 mmol m-3 (16.4 after cleaning) H2O: 800 mmol m-3 (780 after cleaning) P = 101.5 kPa T = 25.0 C Diag: 248 (same after cleaning) Soil CO2 looked good. Downloaded all data before removing. Met looked good. There was no water in the wells. This is probably because Mayberry Slough has been really low. Bryan said they fixed the pumps for the slough just recently, so perhaps the water table will rise soon. Cleaned rad. |
Veg Height (cm): Tape measure from ground to top of plant - mostly dried out
80, 12, 5, 20, 50, 11, 43, 70, 62, 20, 18, 80, 8, 47, 50, 31, 57, 54, 56, 63, avg = 41.9, stdev = 24.37
1 photos found
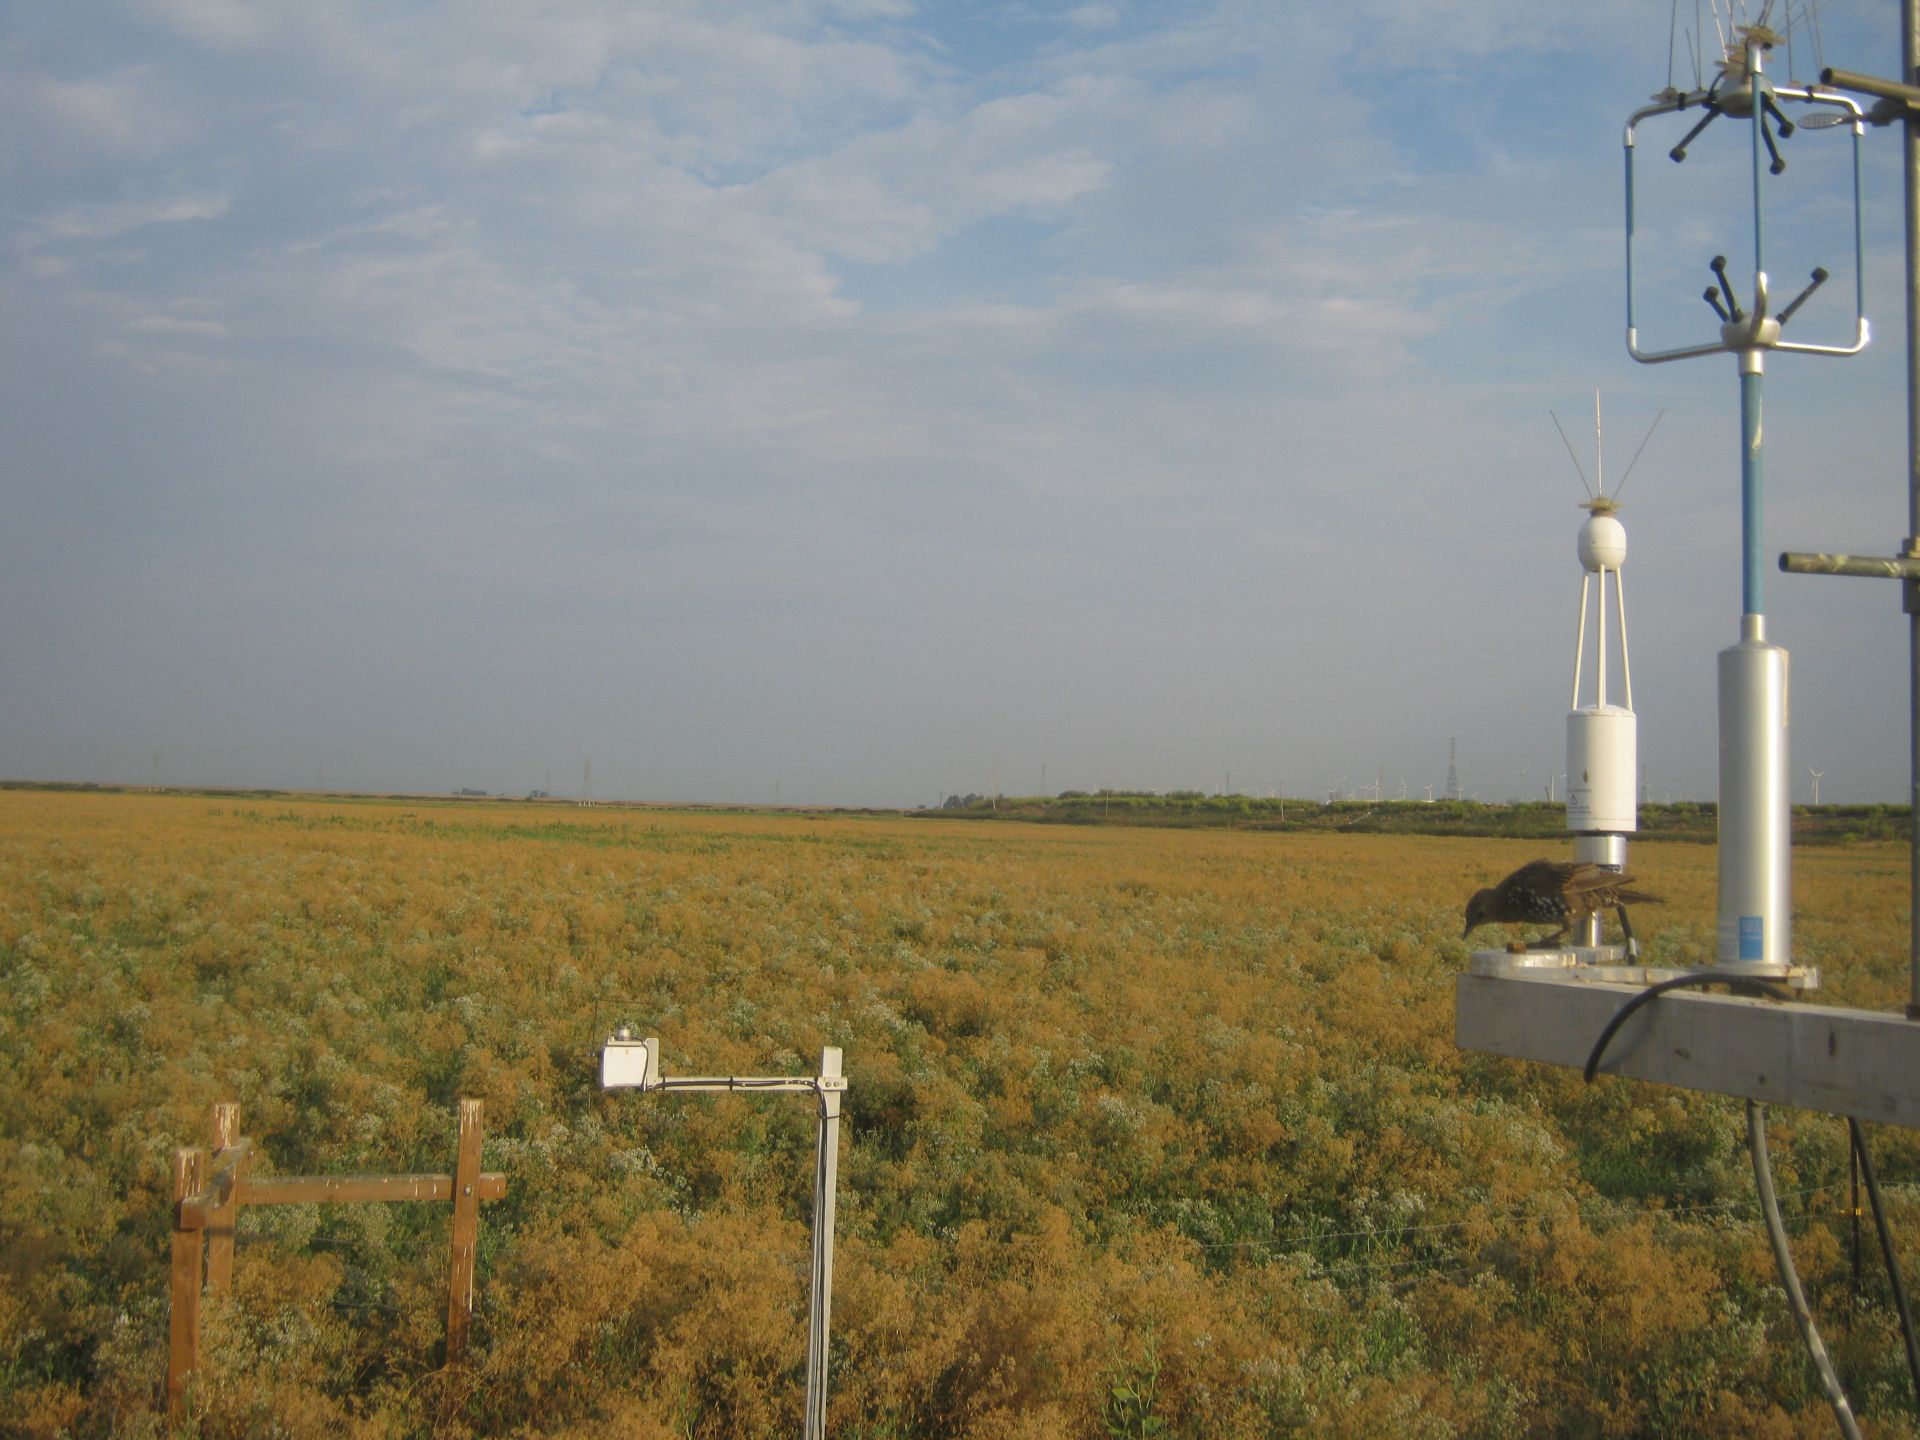
SI_autocam_20140806_0645.jpg ( 2014-08-06 06:45:03 ) Full size: 1920x1440
Starling on tower
7 sets found
No data found for SI_mp.
11 SI_met graphs found
Can't check SI_mixed
2 SI_mixed graphs found
4 SI_flx graphs found
4 SI_soilco2 graphs found
Can't check TWSI_mixed
Can't check SIMBTWEE_met