Field Notes
<--2014-07-23 10:00:00 | 2014-08-07 11:15:00-->Other sites visited today: Sherman Island | Twitchell Rice | East End | West Pond | Twitchell Alfalfa
Phenocam link: Searching...
Mayberry: 2014-07-31 10:00:00 (DOY 212)
Author: Cove Sturtevant
Others: Dennis, Patty
Summary: Moved portable tower to High Veg. Installed quick plugs on portable thermocouple leads. Sulfur smell at High Veg. Water samples at all sites. Fixed error in pressure measurement at permanent tower. Took photos for Ameriflux site visit. Lots of cattail her
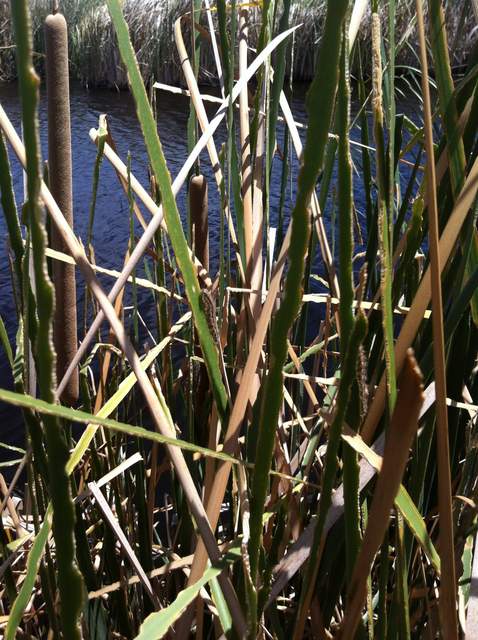
| Mayberry 2014-07-31 Portable Tower We arrived at the Low Veg portable tower site at about 10:00 PDT and moved it to the High Veg site. I put quick release connectors on the thermocouple leads that plug into the 10x at both locations. They are labeled with letters corresponding to matching lettered connectors plugging into the 10x. Downloaded the data. I took water samples at both locations. Took pictures of High Veg footprint. Good readings from the sonic, so the fix last week worked well. I installed a longer post 15-20 m within the footprint of the High Veg site and attached the 10x box to it, installing permanently the thermocouple rod in about 20 cm of water with thick cattails around it. There was a sulfur smell as I walked through the High Veg footprint. Sonic N at Low Veg site: 275° N magnetic. Tower height (High Veg): 3.33 m from sonic arm to truck bed, 61 cm from sonic arm to mid-sonic, 81 cm from truck bed to berm, ~30 cm from berm to water surface. Total height = 5.05 m Readings after install at Low Veg CO2: 385 ppm H2O: 750 mmol m-3 signal strength = 91.4% t: 23.7 °C p = 101.3 kPa sos = 346.8 m s-1 CH4: 1.95 ppm RSSI: 49.5% (73% after cleaning) Permanent Tower All well. Collected data. Patty took water samples. There are A TON of caterpillars eating the cattails. The edges of the cattails look serrated due to all the herbivory (see photo). The tules do not appear affected. I installed a new Met program fixing an error in the pressure readings. I also took lots of photos of the site setup for the Ameriflux folks. Readings: CO2: 393 ppm (same after cleaning) H2O: 810 mmol m-3 (same after cleaning) signal strength = 95.46 after cleaning t: 25.5 °C p = 101.2 kPa sos = 347.8 m s-1 CH4 = 2.0 ppm (same after cleaning) RSSI = 62% (after cleaning) Reservoir full. Met looked good. Cleaned rad. |
1 photos found

20140731MB_CattailHerbivory.jpg ( 2014-07-31 12:15:55 ) Full size: 1434x1920
The edges of the cattails look serrated due to all the herbivory
11 sets found
7 MB_flux graphs found
No data found for MB_met.
28 MB_tule graphs found
Can't check MBWPEESWGT_mixed
1 MB_cam graphs found
Can't check MBEEWPSWEPGT_cam
Can't check SIMBTWEE_met
No data found for MB_minidot.
Can't check MBSWEEWPBCBA
1 MB_processed graphs found
Can't check MB_fd
1 MB_fd graphs found

