Field Notes
<--2014-07-02 11:10:00 | 2014-07-15 15:00:00-->Other sites visited today: Sherman Island | Mayberry | Twitchell Rice | East End | West Pond
Phenocam link: Searching...
Twitchell Alfalfa: 2014-07-08 15:30:00 (DOY 189)
Author: Patty Oikawa
Others: Madeleine, Kathleen
Summary: Wet road, heat flux plate found out of soil again, broke meter stick
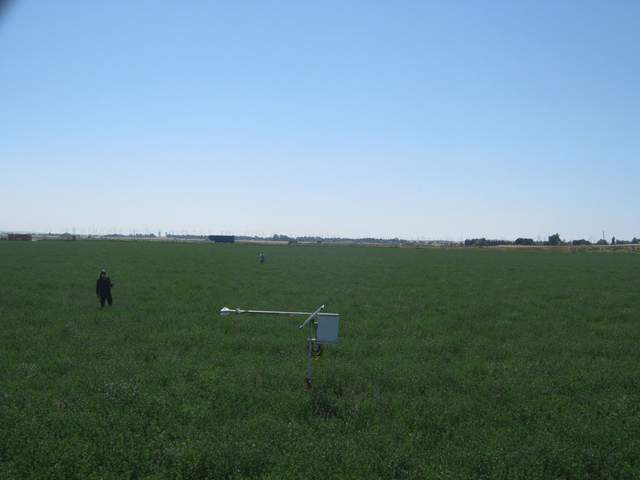
| We arrived at 15:30. There was a light breeze and a cloudless sky. The road to the tower was wet the whole way so we parked and hiked in. The alfalfa is tall and flowering and smelling great. I think this is my favorite site. Mad measured veg height and cleaned the radiation sensors which she noted were very dirty. Kathleen measured LAI. I collected data and stepped on the meter stick (by accident-opps). I noticed the same heat flux plate from last week was pulled out of the ground (sn 6342). I reburied at 2cm near the tower. This needs to be re-installed properly. 7500 CO2: 390.83 umol/mol (394.58 after cleaning) H2O: 720.1 mmol/m3 (763.7 after cleaning) SS: 93.85% (94.81 after cleaning) Pressure: 100.89 kPa Temperature: 32.47ËšC SOS: 353.1 m s-1 Met: OK |
Veg Height (cm): Tape measure from ground to top of plant
40, 35, 50, 50, 50, 35, 50, 40, 60, 60, 50, 50, 40, 40, 60, 55, 50, 55, avg = 48.3, stdev = 8.22
1 photos found

TA_autocam_20140708_1445.jpg ( 2014-07-08 14:45:02 ) Full size: 1920x1440
Fieldwork
7 sets found
Can't check TA_met
11 TA_met graphs found
Can't check TA_rad
3 TA_rad graphs found
Can't check TA_flux
5 TA_flux graphs found
Can't check TA_soilco2
7 TA_soilco2 graphs found
No data found for TA_arable.
1 TA_cam graphs found
Can't check TATWBABCSB_cam

