Field Notes
<--2014-06-26 15:00:00 | 2014-07-08 15:30:00-->Other sites visited today: Tonzi | Vaira | Sherman Island | Mayberry | Twitchell Rice | East End | West Pond
Phenocam link: Searching...
Twitchell Alfalfa: 2014-07-02 11:10:00 (DOY 183)
Author: Patty Oikawa
Others: Joe, Madeleine, Kathleen
Summary: Installed Picarro, water additions to collar, heat flux plate loose
| Arrived at 11:10am. We installed the Picarro and forerunner chamber using 3 marine batteries and inverter. Chamber was working by 11:30am. Kathleen collected clip plots and Madeleine measured veg height. I noticed that a heat flux plate (HFP01-15 6342) was sitting on the soil surface—must have been pulled up by accident. Kathleen reinstalled it 2cm beneath the soil next to the tower—this needs to be reburied later. Joe used the weed wacker to cut down tall weeds around the tower. We returned to this site later to add water to the collar. We added 665mL water to the collar at 14:31. This elicited a huge CO2 and N2O response. N2O went from 0.33ppm to 11pm and CO2 went from 400ppm to 1890ppm inside the chamber! The Picarro was disassembled and moved back to Sherman at 16:34. 7500 CO2: 395.8 umol/mol H2O: 686.0 mmol/m3 SS: 94.1% Pressure: 100.9 kPa Temperature: 25.8˚C SOS: 348 m s-1 Met: OK |
Veg Height (cm): Tape measure from ground to top of plant
30, 40, 20, 35, 25, 40, 40, 40, 30, 25, 25, 20, 25, 15, 35, 30, 40, 20, 25, 30, avg = 29.5, stdev = 7.93
1 photos found

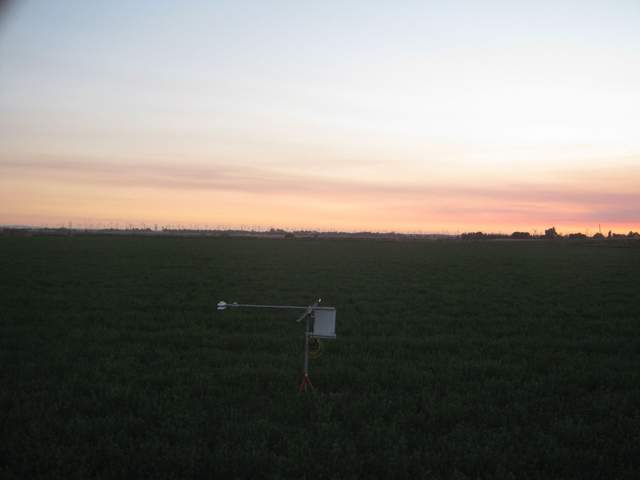
TA_autocam_20140702_1945.jpg ( 2014-07-02 19:45:02 ) Full size: 1920x1440
Smoke at dusk
7 sets found
Can't check TA_met
11 TA_met graphs found
Can't check TA_rad
3 TA_rad graphs found
Can't check TA_flux
5 TA_flux graphs found
Can't check TA_soilco2
7 TA_soilco2 graphs found
No data found for TA_arable.
1 TA_cam graphs found
Can't check TATWBABCSB_cam

