Field Notes
<--2014-05-13 08:30:00 | 2014-05-29 15:15:00-->Other sites visited today: Sherman Island | Mayberry | West Pond | East End | Twitchell Rice
Phenocam link: Searching...
Twitchell Alfalfa: 2014-05-21 11:30:00 (DOY 141)
Author: Sara Knox
Others: Joe and Madeleine
Summary: Standard fieldwork, cut alfalfa baled and removed from the field, fixed soil temps.
| Alfalfa 2014-05-21 I arrived about 11:30 PDT with Joe and Madeleine. It was clear, sunny and warm with a light breeze. The cut alfalfa has been baled and removed from the field. The irrigation ditches to the north of both fields were full of water again. Ants were in the corner of the box door, but seemed to have vacated the data logger. I chased the ants out and stuffed more putty into the wire ports. The soil temps on the mux seemed okay. Unfortunately I left the test program running on the data logger so no measurements were recorded (the radiation measurements should be okay but I didn't check the CR10X). I think the "bad" readings I saw last time were because the CR1000 and it reference temperature were in the sun and the mux was in the shade. This elevated all the soil temps to unreasonable values. I reinstalled the usual program and things should be back to normal. 7500 read: 398 ppm CO2, 640 mmol/m3 H2O, 92.7 SS, 101.29 kPa, 24.55 C Madeleine and I did spectral measurements and vegetation height. |
Veg Height (cm): Tape measure from ground to top of plant
30, 26, 33, 24, 20, 27, 31, 36, 27, 30, 34, 23, 20, 27, 26, 20, 23, 21, 39, 18, avg = 26.8, stdev = 5.85
2 photos found

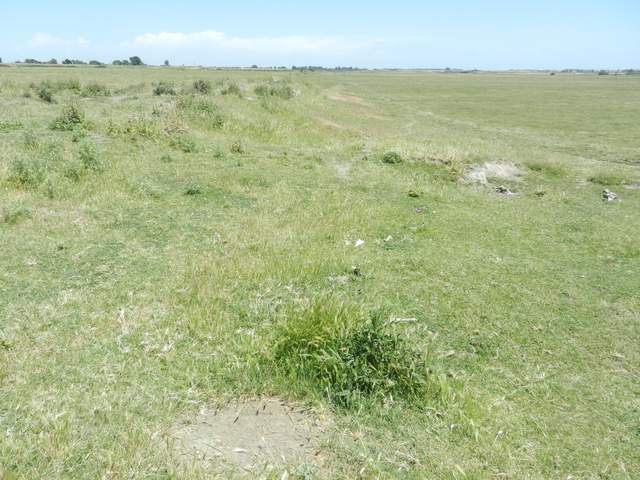
20140521TP_ElevationChange.jpg ( 2014-05-21 13:39:41 ) Full size: 1920x1440
Elevation change in Twitchell pasture

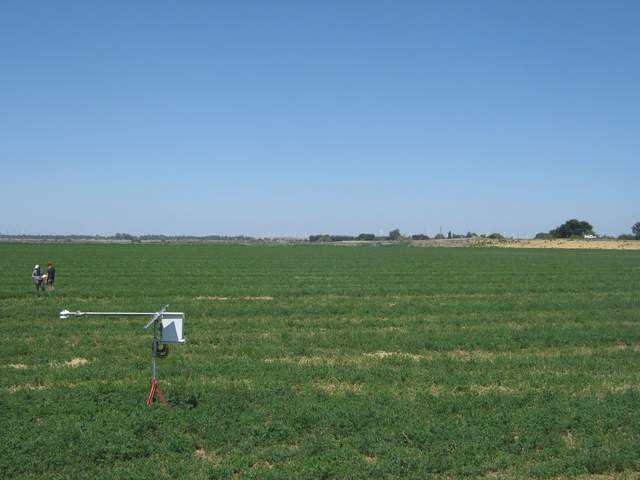
TA_autocam_20140521_1045.jpg ( 2014-05-21 10:45:02 ) Full size: 1920x1440
Sara and other doing spectral measurements
7 sets found
Can't check TA_met
11 TA_met graphs found
Can't check TA_rad
3 TA_rad graphs found
Can't check TA_flux
5 TA_flux graphs found
Can't check TA_soilco2
7 TA_soilco2 graphs found
No data found for TA_arable.
1 TA_cam graphs found
Can't check TATWBABCSB_cam

