Field Notes
<--2014-04-03 10:30:00 | 2014-04-17 09:00:00-->Other sites visited today: Mayberry | Twitchell Rice | East End | West Pond | Twitchell Alfalfa
Phenocam link: Searching...
Sherman Island: 2014-04-10 09:00:00 (DOY 100)
Author: Cove Sturtevant
Others: Joe, Sara
Summary: Standard fieldwork. Soil respiration IRGA acting funny. Installed new LED cover. Determined depths of Theta probes. Pulled Theta P2.
| Sherman 2014-04-10 We arrived about 9:00 PDT. It was sunny and cool with a good breeze from the west. Pepperweed continues to grow but is being kept in check by cow feet. Sara attempted to do soil respiration but the IRGA was acting funny, so no measurements this time. Sara continued with spectra, moisture point, and well depth while I attended to the tower, downloaded data, and did a veg height survey. Joe made a new cover for the LED sensor which has had a puncture in it for a few weeks. The computer was off when we arrived. It restarted fine. Only a few daily Met files were available, but it looked like the remaining data was dumped into today’s file. I checked which Theta moisture probe serial numbers corresponded to the channels in the logger: P1: sn 70/002 – at 20 cm according to Matteo’s old notes P2: sn 139/052 – pulled sensor, was recently installed but giving bad measurements. Previously was 64/20 at 30 cm. P3: sn 64/068 – at 10 cm according to Matteo’s old notes Joe swapped CO2 profile Set A with brand new probes: -2cm, sn H1630066 (1%) removed, sn K1340005 (3%) installed -8cm, sn F4960019 (3%) removed, sn K1340007 (3%) installed -16cm, sn G0150035 (3%) removed, sn K1340006 (3%) installed There were earwigs in the casings, especially the -16cm one. Patty reported that the pressure in the Met was giving bad readings and I confirmed this upon arriving, but after fiddling with the Theta probes the pressure was fine. Patty said she’d keep an eye on it in the data. LGR readings: 1.94 ppm, 09:05, 20.79 C, 135.3 Torr (adjusted to 144.5 Torr), 14.76 us, 10 Hz 7500 readings: CO2: 17.4 mmol m-3 (same after cleaning) H2O: 660 mmol m-3 (same after cleaning) P = 101.5 kPa T = 16.9 C Diag: 249 (same after cleaning) Sos: 341.9 m s-1 Met & Soil CO2 looked good. Cleaned radiation sensors. |
2 photos found

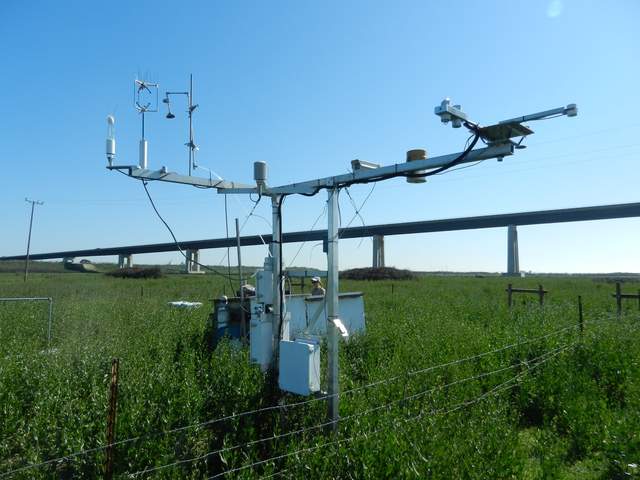
20140410SI_Tower.jpg ( 2014-04-10 10:10:22 ) Full size: 1920x1440
Cow pasture eddy tower and tall pepper weed

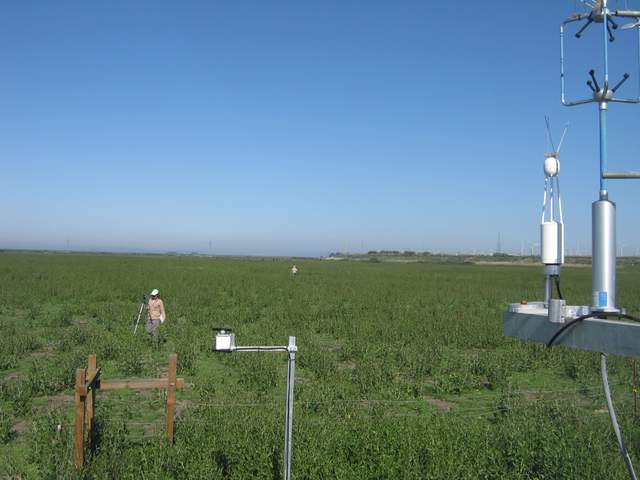
SI_autocam_20140410_0915.jpg ( 2014-04-10 09:15:03 ) Full size: 1920x1440
Fieldwork in the pepper weed on the cow pasture
7 sets found
No data found for SI_mp.
11 SI_met graphs found
Can't check SI_mixed
2 SI_mixed graphs found
4 SI_flx graphs found
3 SI_soilco2 graphs found
Can't check TWSI_mixed
Can't check SIMBTWEE_met

