
Field Notes
<--2014-03-27 09:00:00 | 2014-04-10 09:00:00-->Other sites visited today: Mayberry | Twitchell Rice | East End | West Pond | Twitchell Alfalfa
Phenocam link: Searching...
Sherman Island: 2014-04-03 10:30:00 (DOY 93)
Author: Sara Knox
Others: Patty
Summary: Standard field work. Reloaded old program for soil CO2.
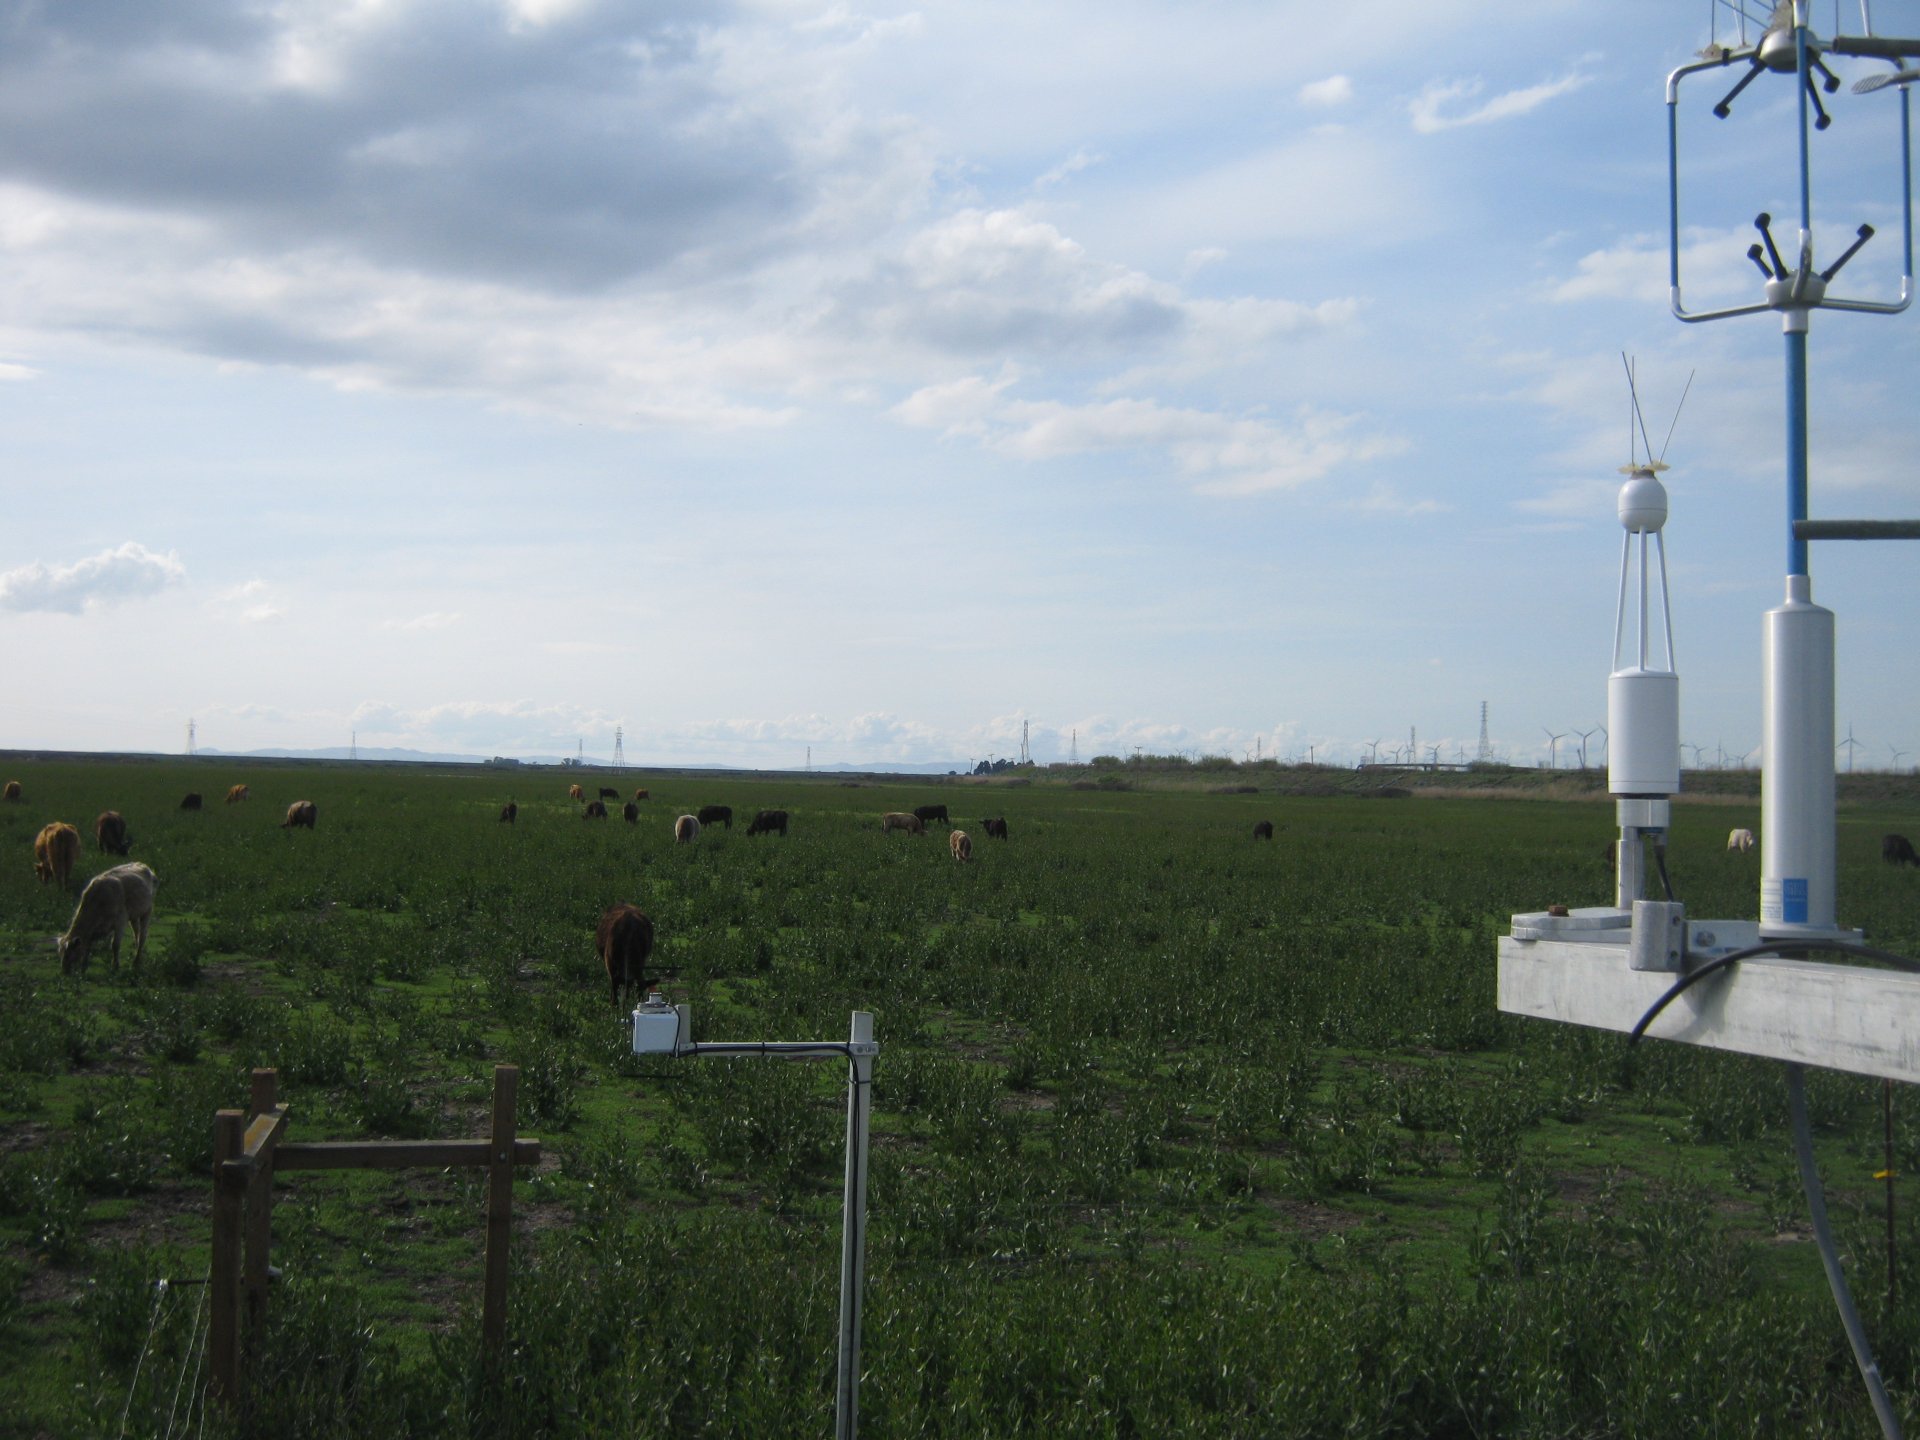
| Sherman 2014-04-03 We arrived about 10:30 PDT. It was slightly overcast and cool with a mild breeze. The pepperweed continues to grow and the grass understory is still present. Patty did spectral, and moisture point while I attended to the tower. Met and Flux readings looked good. We decided not to pull soil moisture probes 1 and 3 since the values seemed similar to the theta probes near the CO2 system. Soil moisture probe 2 was actually giving much lower readings then all the other probes (~100 vs 500-600 mV). I did veg height, well depth and LAI 2000 measurements while Patty reloaded the old program for the soil CO2 system since the latest program didn’t seem to be working. LGR readings: 1.977 ppm, 20.95 C, 142.16 Torr, 14.77 us, 10 Hz 7500 readings: CO2: 17.64 mmol m-3 (same after cleaning) H2O: 503 mmol m-3 (same after cleaning) P = 101.84 kPa T = 13.89 C Diag: 249 (same after cleaning) Sos: 341.2 m s-1 |
Veg Height (cm): Tape measure from ground to top of plant - short green grass layer and pepperweed really taking off
75, 69, 79, 2, 67, 2, 40, 38, 30, 0, 45, 30, 70, 32, 2, 58, 0, 40, 62, 64, avg = 40.3, stdev = 27.55
1 photos found
SI_autocam_20140403_1545.jpg ( 2014-04-03 15:45:03 ) Full size: 1920x1440
Cows on the pasture
7 sets found
No data found for SI_mp.
11 SI_met graphs found
Can't check SI_mixed
2 SI_mixed graphs found
4 SI_flx graphs found
3 SI_soilco2 graphs found
Can't check TWSI_mixed
Can't check SIMBTWEE_met