Field Notes
<--2014-01-10 14:00:00 | 2014-02-05 14:45:00-->Other sites visited today: Sherman Island | Mayberry | Twitchell Rice | West Pond | Twitchell Alfalfa
Phenocam link: Searching...
East End: 2014-01-23 13:20:00 (DOY 23)
Author: Joe Verfaillie
Others: Patty
Summary: New boardwalks are in place, water level is climbing, standard data collection.
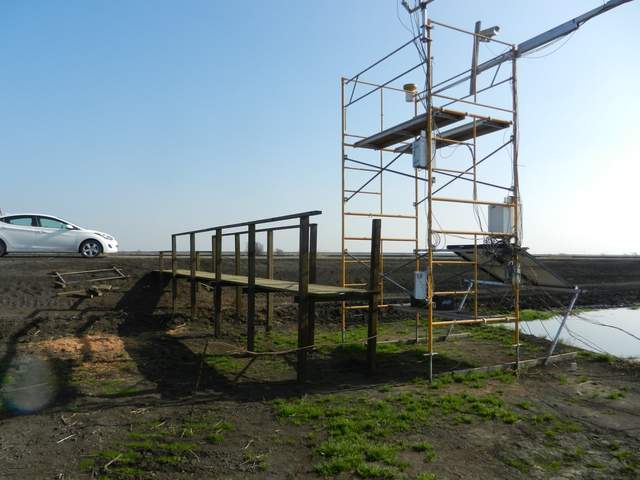
| EastEnd 2014-01-23 I arrived about 1:20pm with Patty. It was hazy, sunny and mild with little to no wind. Strangely, in Berkeley this morning it was clear with strong gusty winds. The new boardwalks have been built. 4x4 post driven into the ground with 2x12 planking for a deck and a 2x4 railing. Looks really nice. The water level has come up quite a bit, but the ground around the tower is still dry. The 7700 read: 2.22ppm CH4, 29.79 RSSI – after cleaning 86 RSSI The 7500 read: 17.6mmol/m3 CO2, 322mmol/m3 H2O, 19.16C, 101.24kPa, 249diag Patty cleaned the solar panels and instruments. She said the radiometers were really dirty again. I brought the wrong CF card for the CR1000. I copied the data from the current card and reinserted the card. The card was taking a long time to format so we went to the Alfalfa and came back later to check the card. The card was okay but we should probably retire it. |
3 photos found

20140123EE_NewBoardwalk.jpg ( 2014-01-23 14:13:32 ) Full size: 1920x1440
The new boardwalks have been built. 4x4 post driven into the ground with 2x12 planking for a deck and a 2x4 railing

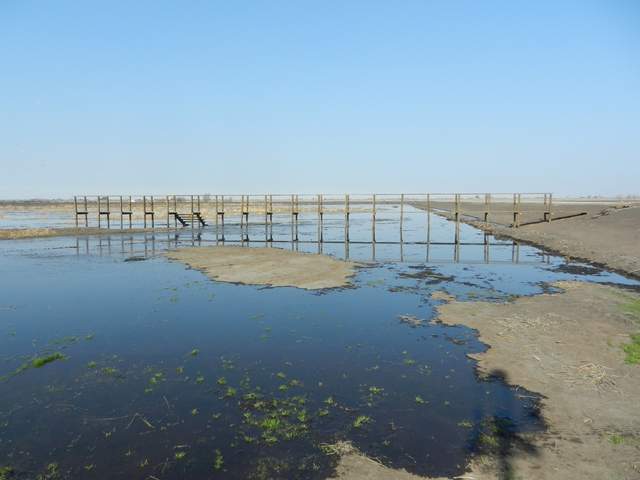
20140123EE_WyattsBoardwalk.jpg ( 2014-01-23 14:13:06 ) Full size: 1920x1440
Wyatt's boardwalk

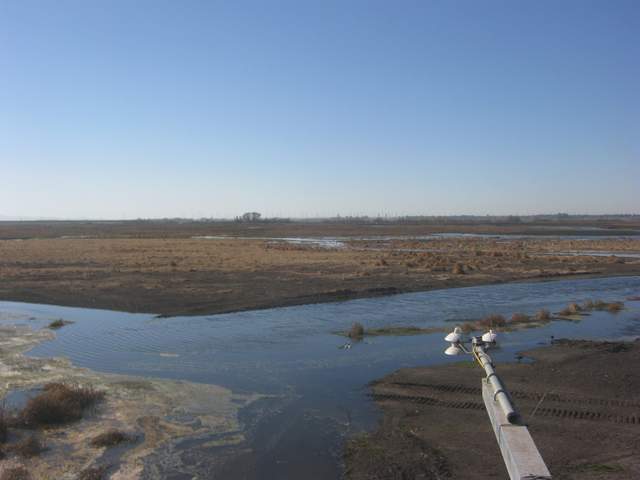
EE_autocam_20140122_1415.jpg ( 2014-01-22 14:15:02 ) Full size: 1920x1440
Tractor tracts
11 sets found
14 EE_met graphs found
Can't check EE_mixed
1 EE_mixed graphs found
8 EE_flux graphs found
Can't check MBWPEESWGT_mixed
1 EE_cam graphs found
Can't check MBEEWPSWEPGT_cam
Can't check SIMBTWEE_met
Can't check EE_Temp
5 EE_Temp graphs found
Can't check EE_minidot
1 EE_minidot graphs found
Can't check MBSWEEWPBCBA
1 EE_processed graphs found

