
Field Notes
<--2014-01-10 13:30:00 | 2014-02-05 14:15:00-->Other sites visited today: Sherman Island | Mayberry | Twitchell Rice | East End | Twitchell Alfalfa
Phenocam link: Searching...
West Pond: 2014-01-23 12:20:00 (DOY 23)
Author: Joe Verfaillie
Others: Patty
Summary: Water low - increased flow at inlet, East Pond bulldozed, installed new Forerunner CO2 probe.
| West Pond 2013-01-23 I arrived about 12:20 with Patty. It was hazy, sunny and mild with little to no wind. Strangely, in Berkeley this morning it was clear with strong gusty winds. Jim was busy with a bulldozer in the East Pond. He was pushing all the vegetation out of the pond onto the sides. From there they were spreading them around the new wetland. Jim promised to avoid our solar panels. The inlet was running but at a low level. The water in the West Pond was well down below the CO2 and conductivity sensors but the DO was still in a bit of water. On the way out I increased the inlet flow about double on Jim’s advice. The 7500 read: 437ppm CO2, 322mmol/m3 H2O, 17.5C, 101.3kPa, 96.26SS The 7700 read: 2.333ppm CH4, 32.6 RSSI – after cleaning 85.6 RSSI The wash reservoir was full We installed the new GP-001 water proof CO2 sensor from Forerunner sn GP2013ex01. It was a simple 12V power and three SE voltage measurements giving CO2, Temperature and RH inside the housing. The measurements are recorded as mV. All data was collected before and new program was uploaded to the CR1000. In air the probe read 77, 3311, 2392, in water the CO2 quickly climbed to 455mV and was still climbing. |
2 photos found

20140123WP_EastPond.jpg ( 2014-01-23 14:08:05 ) Full size: 1920x1440
East Pond
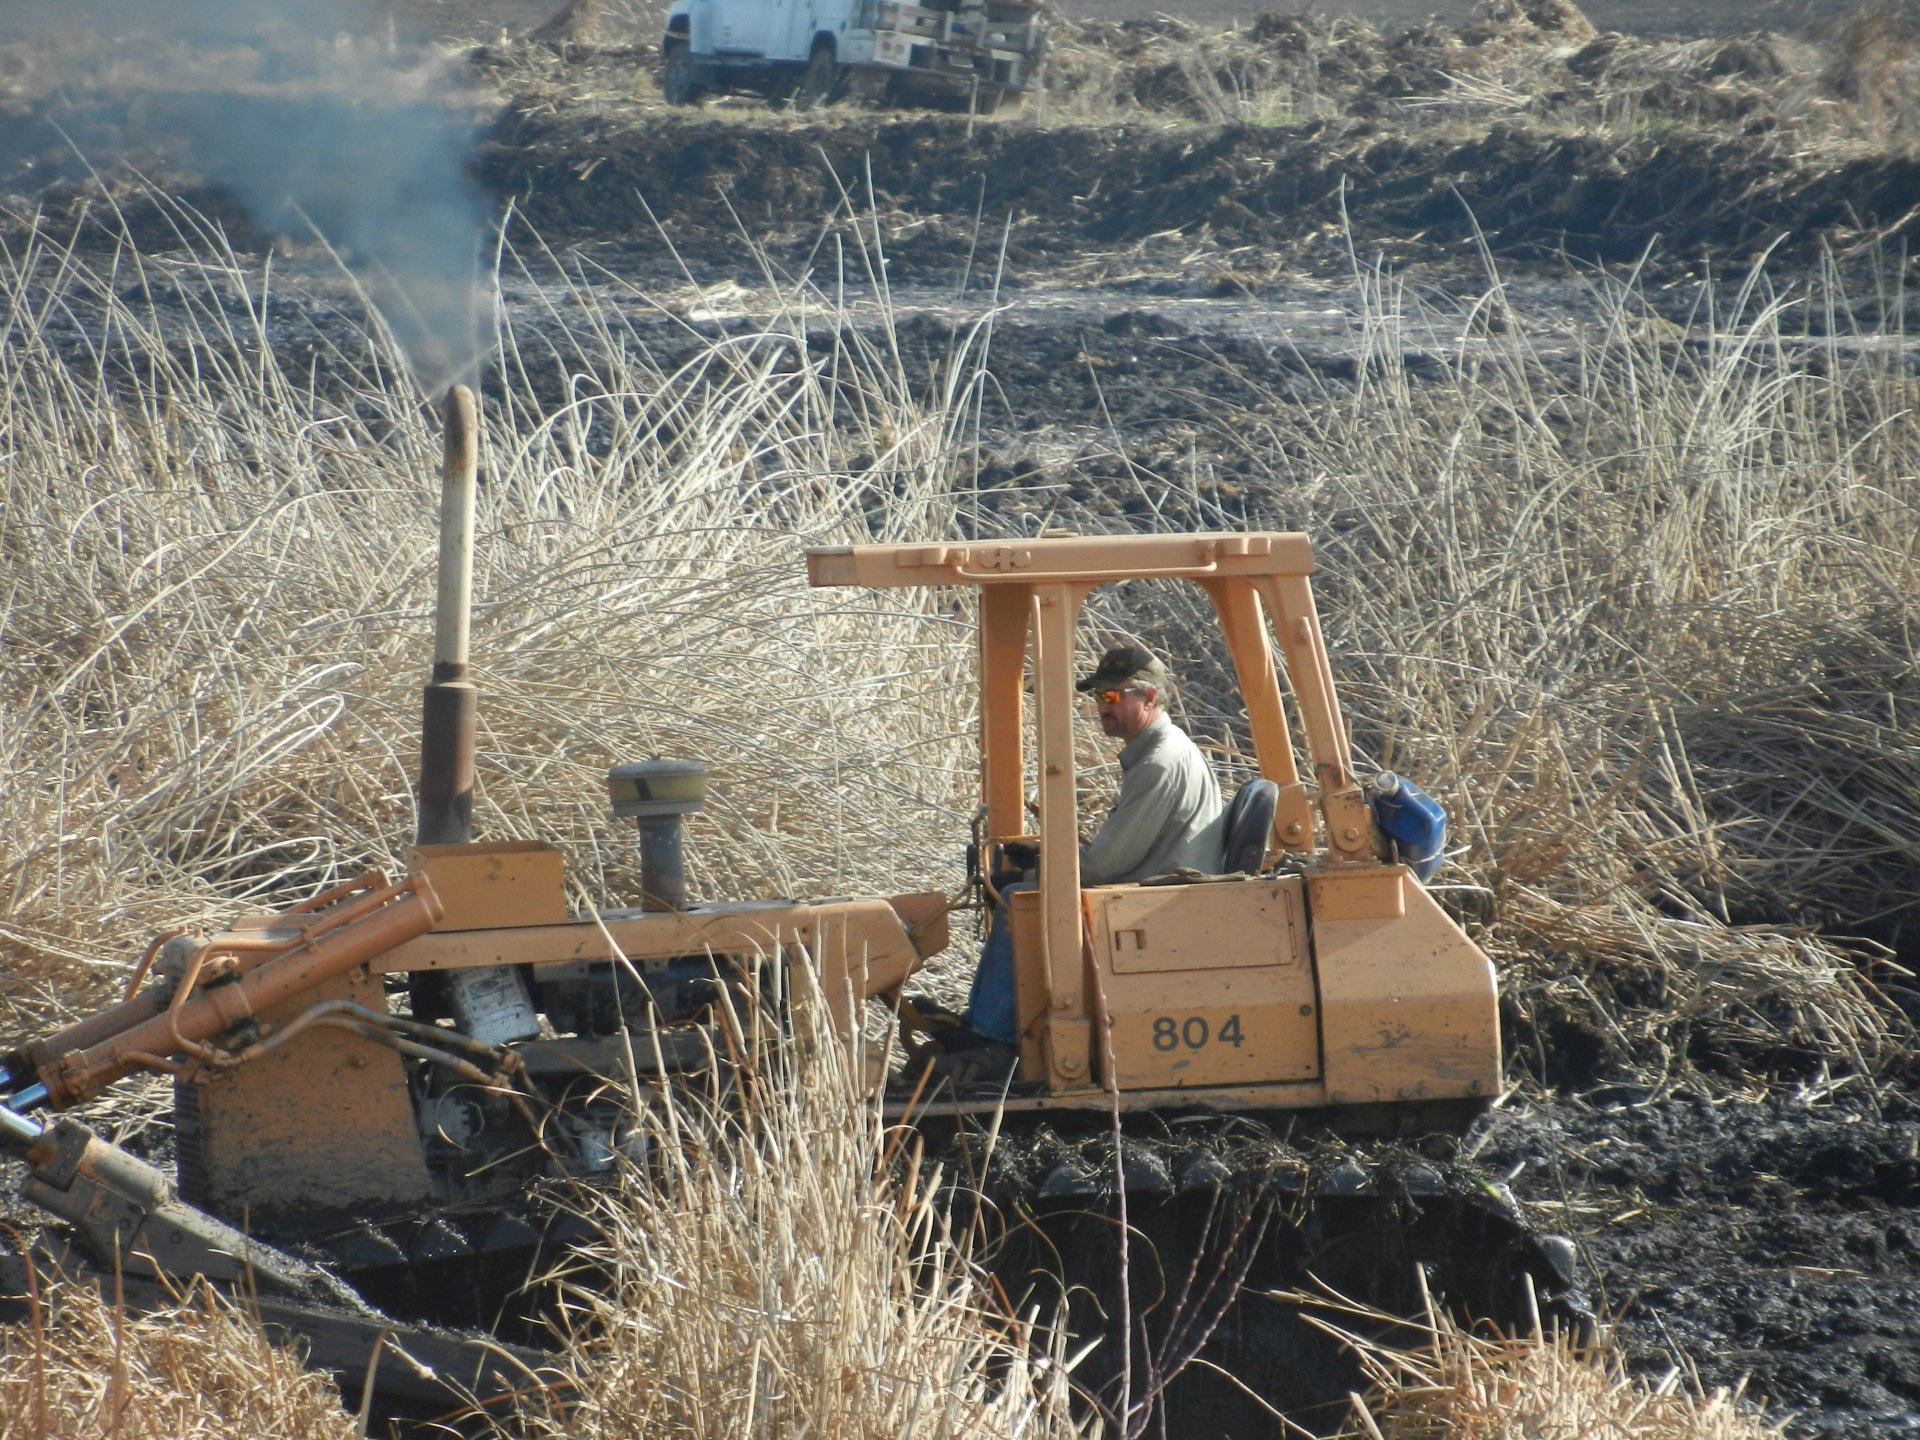
20140123WP_JimEastPond.jpg ( 2014-01-23 13:17:37 ) Full size: 1920x1440
Jim was busy with a bulldozer in the East Pond. He was pushing all the vegetation out of the pond onto the sides
8 sets found
Can't check WP_DO
1 WP_DO graphs found
14 WP_met graphs found
5 WP_flux graphs found
Can't check MBWPEESWGT_mixed
Can't check MBEEWPSWEPGT_cam
Can't check MBSWEEWPBCBA
1 WP_processed graphs found
No data found for WP_arable.