
Field Notes
<--2013-12-19 13:00:00 | 2014-01-23 13:20:00-->Other sites visited today: Sherman Island | Mayberry | Twitchell Rice | West Pond | Twitchell Alfalfa
Phenocam link: Searching...
East End: 2014-01-10 14:00:00 (DOY 10)
Author: Cove Sturtevant
Others: Joe, Dennis
Summary: Veg material or seedlings planted along berms. Sealed 7700 reservoir filter with silicone tape. Tower reading A-ok.
| East End Wetland 2014-01-10 We arrived about 14:00 PST. It was warm, pretty calm, and sunny. Seedlings of tules or cattails and/or material from the East Pond has been planted/placed at close intervals along the berms to facilitate quick vegetation establishment at the site. We met Bryan + company and Wyatt at the site. Bryan is going to install a sampling boardwalk for Wyatt ~100m north of the tower. He’ll construct one for us from the berm out to the tower. We downloaded data and cleaned the flux instruments. There was a leak in the filter of the 7700 reservoir and Joe sealed it with silicone tape. Denis loved the tape so much he vowed to obtain his own supply (stocking stuffer next year???). 7500 readings: CO2 = 16.9 mmol m-3 (17.3 after cleaning) H2O = 445 mmol m-3 (same after cleaning) Diag: 250 (249 after cleaning) t = 19.3 C p = 102.2 kPa 7700 readings: CH4: 2.08 ppm (same after cleaning) RSSI: 34% (68% after cleaning) Reservoir was nearly empty. MET looked good. There was bird doodie in the rain gauge and all over the solar panels -> cleaned. Radiometers were supper dirty from bird feet. |
3 photos found
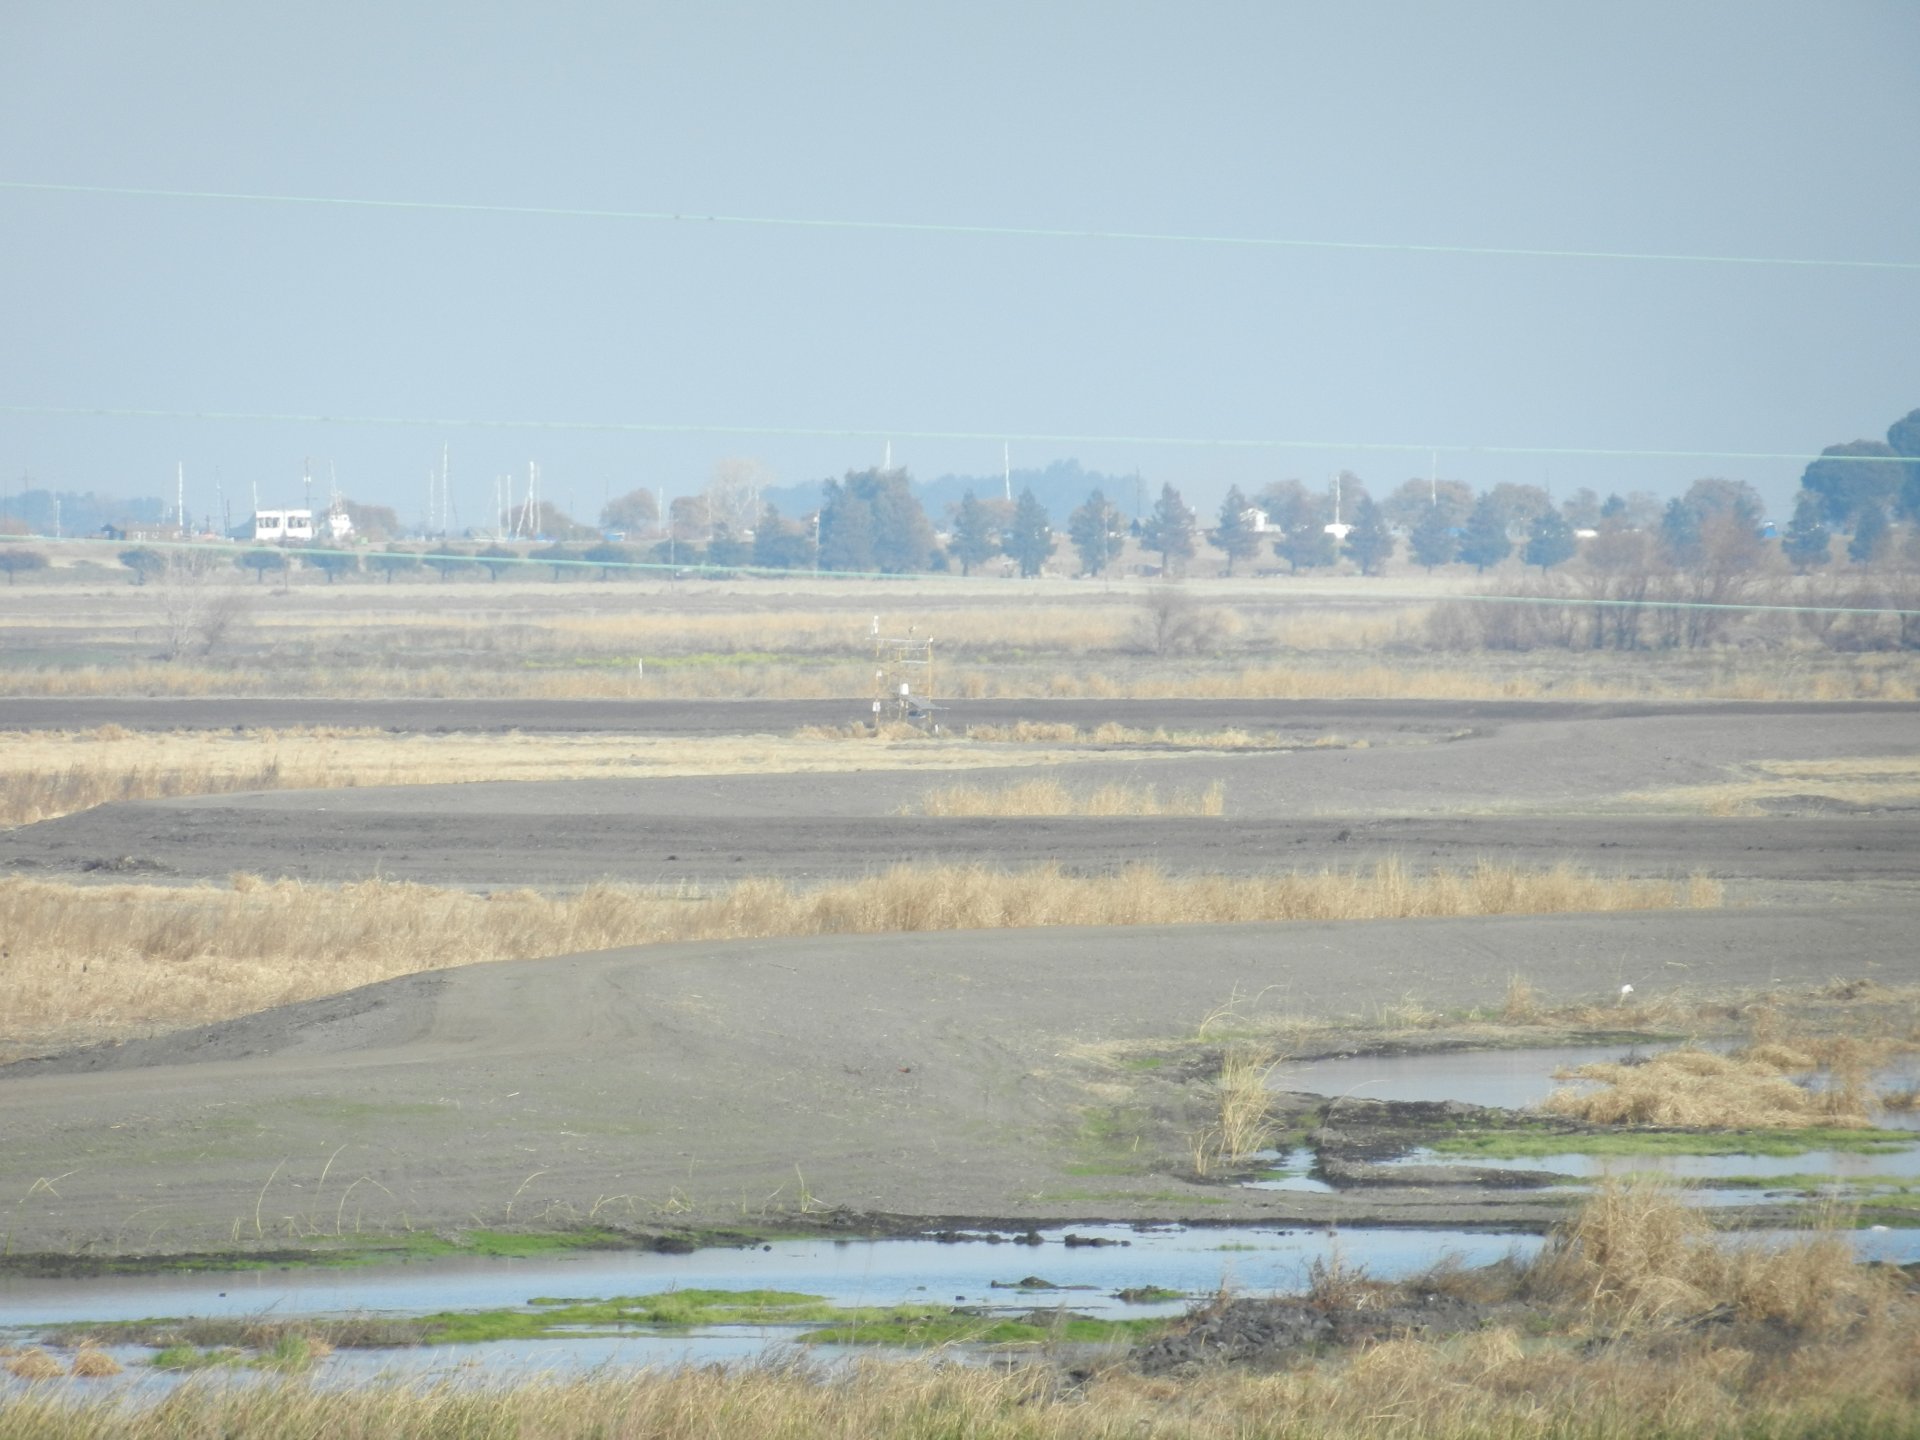
20140110EE_TowerLongView.jpg ( 2014-01-10 14:17:19 ) Full size: 1920x1440
A long view of the East End Tower
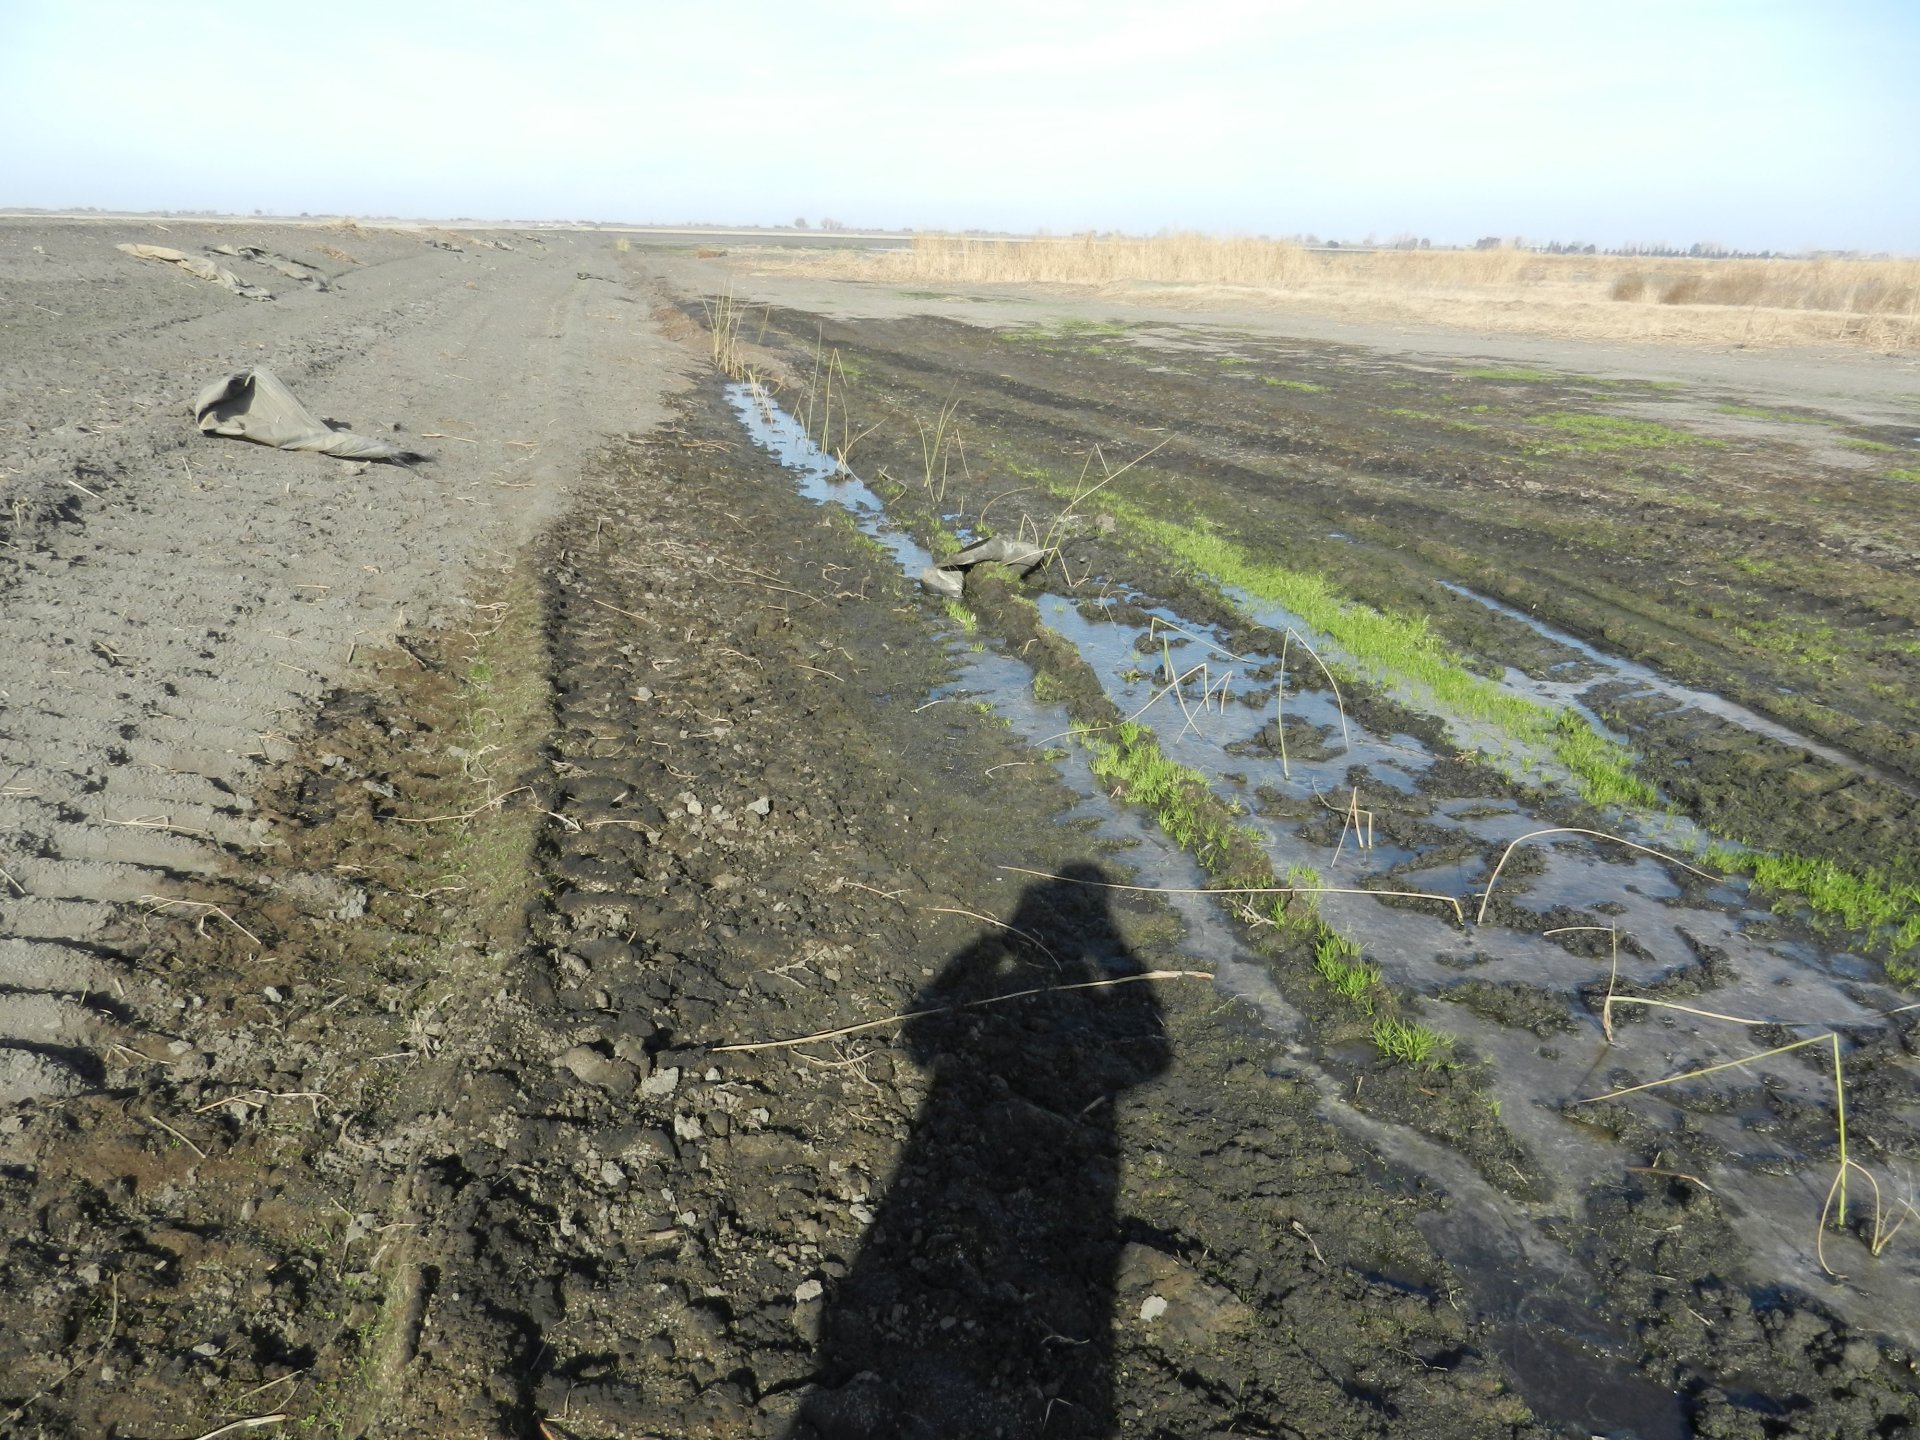
20140110EE_PlantedTules.jpg ( 2014-01-10 14:52:54 ) Full size: 1920x1440
New tules planted near the East End Tower
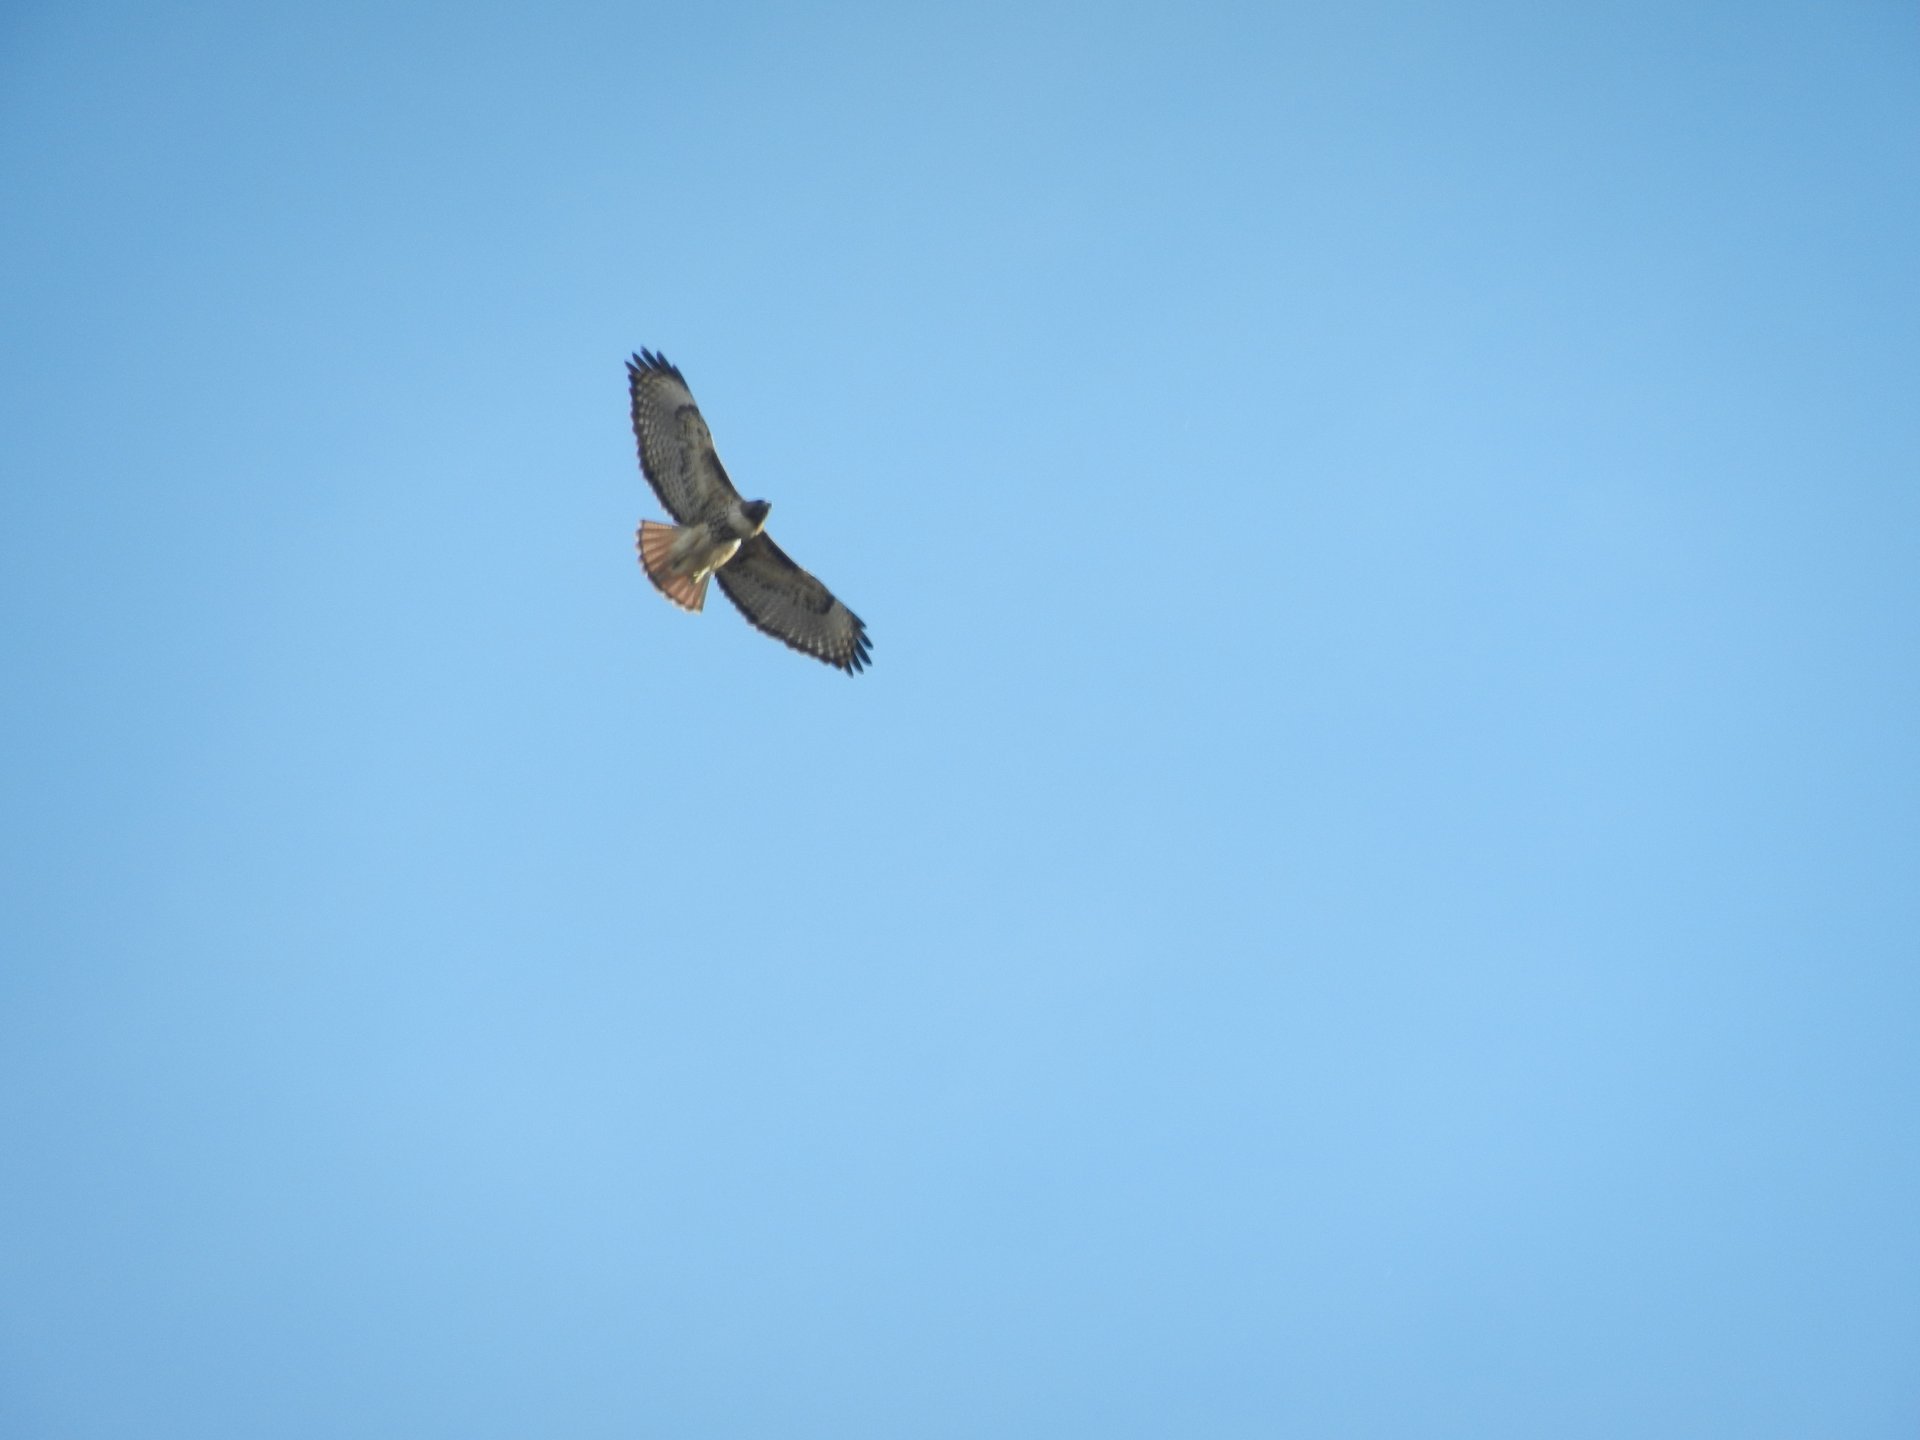
20140110EE_Redtail.jpg ( 2014-01-10 15:39:23 ) Full size: 1920x1440
Redtail hawk
11 sets found
14 EE_met graphs found
Can't check EE_mixed
1 EE_mixed graphs found
8 EE_flux graphs found
Can't check MBWPEESWGT_mixed
1 EE_cam graphs found
Can't check MBEEWPSWEPGT_cam
Can't check SIMBTWEE_met
Can't check EE_Temp
5 EE_Temp graphs found
Can't check EE_minidot
1 EE_minidot graphs found
Can't check MBSWEEWPBCBA
1 EE_processed graphs found