
Field Notes
<--2014-01-10 09:30:00 | 2014-01-29 09:30:00-->Other sites visited today: Mayberry | Twitchell Rice | West Pond | East End | Twitchell Alfalfa
Phenocam link: Searching...
Sherman Island: 2014-01-23 09:20:00 (DOY 23)
Author: Joe Verfaillie
Others: Patty
Summary: Standard fieldwork, no 6400 measurements, Vaisala CO2 probes removed for calibration.
| Sherman 2014-01-23 I arrived about 9:20 with Patty. It was hazy, sunny and mild with little to no wind. Strangely, in Berkeley this morning it was clear with strong gusty winds. The field is as brown as I have ever seen it I think. The annual grasses look very sad. Patty pulled all the Vaisala CO2 probes and casings out of the ground. The probes will be recalibrated and the casing improved. There was condensation on some of the probes. Patty can provide sn and details. Note from Patty: Theta probes at profile A and B were moved down from 12cm depth to 20cm depth. Also, we pulled the thermocouple at 16cm depth from Profile B--this needs to be replaced/fixed. CO2 probes at 16cm depth with profile A (sn G0150035) and B (sn G0150037) were moist, but all other probes looked fine (Profile A 2cm: sn F4960020, 8cm: sn G0150034; Profile B 2cm : sn G0150036, 8cm: sn F4960018). The LGR read 9:23PST, 17.4C, 112.74Torr, 14.808usec, 10Hz, 2.521ppm I adjusted the bypass valve to bring the pressure up to 146.0Torr. The 7500 read: 18.0mmol/m3 CO2, 343.0mmol/m3 H2O, 101.7kPa, 13.21C, 248diag The met data was okay and all clocks were okay. Well depths were: North 132cm, South old: 91cm, South new 93cm The moisture point probes read: East: 38.7, 44.2, 60.5, 11.1; 33.2, 43.9, 60.5, 11.1 North: 44.3, 44.8, 49.4, 88.1; 44.0, 45.4, 48.3, 89.0 I did spectra measurements at eight locations in the field. I brought the wrong CF cards from the CR1000. I downloaded the current data from the card, erased the card and put it back into the CR1000. |
1 photos found
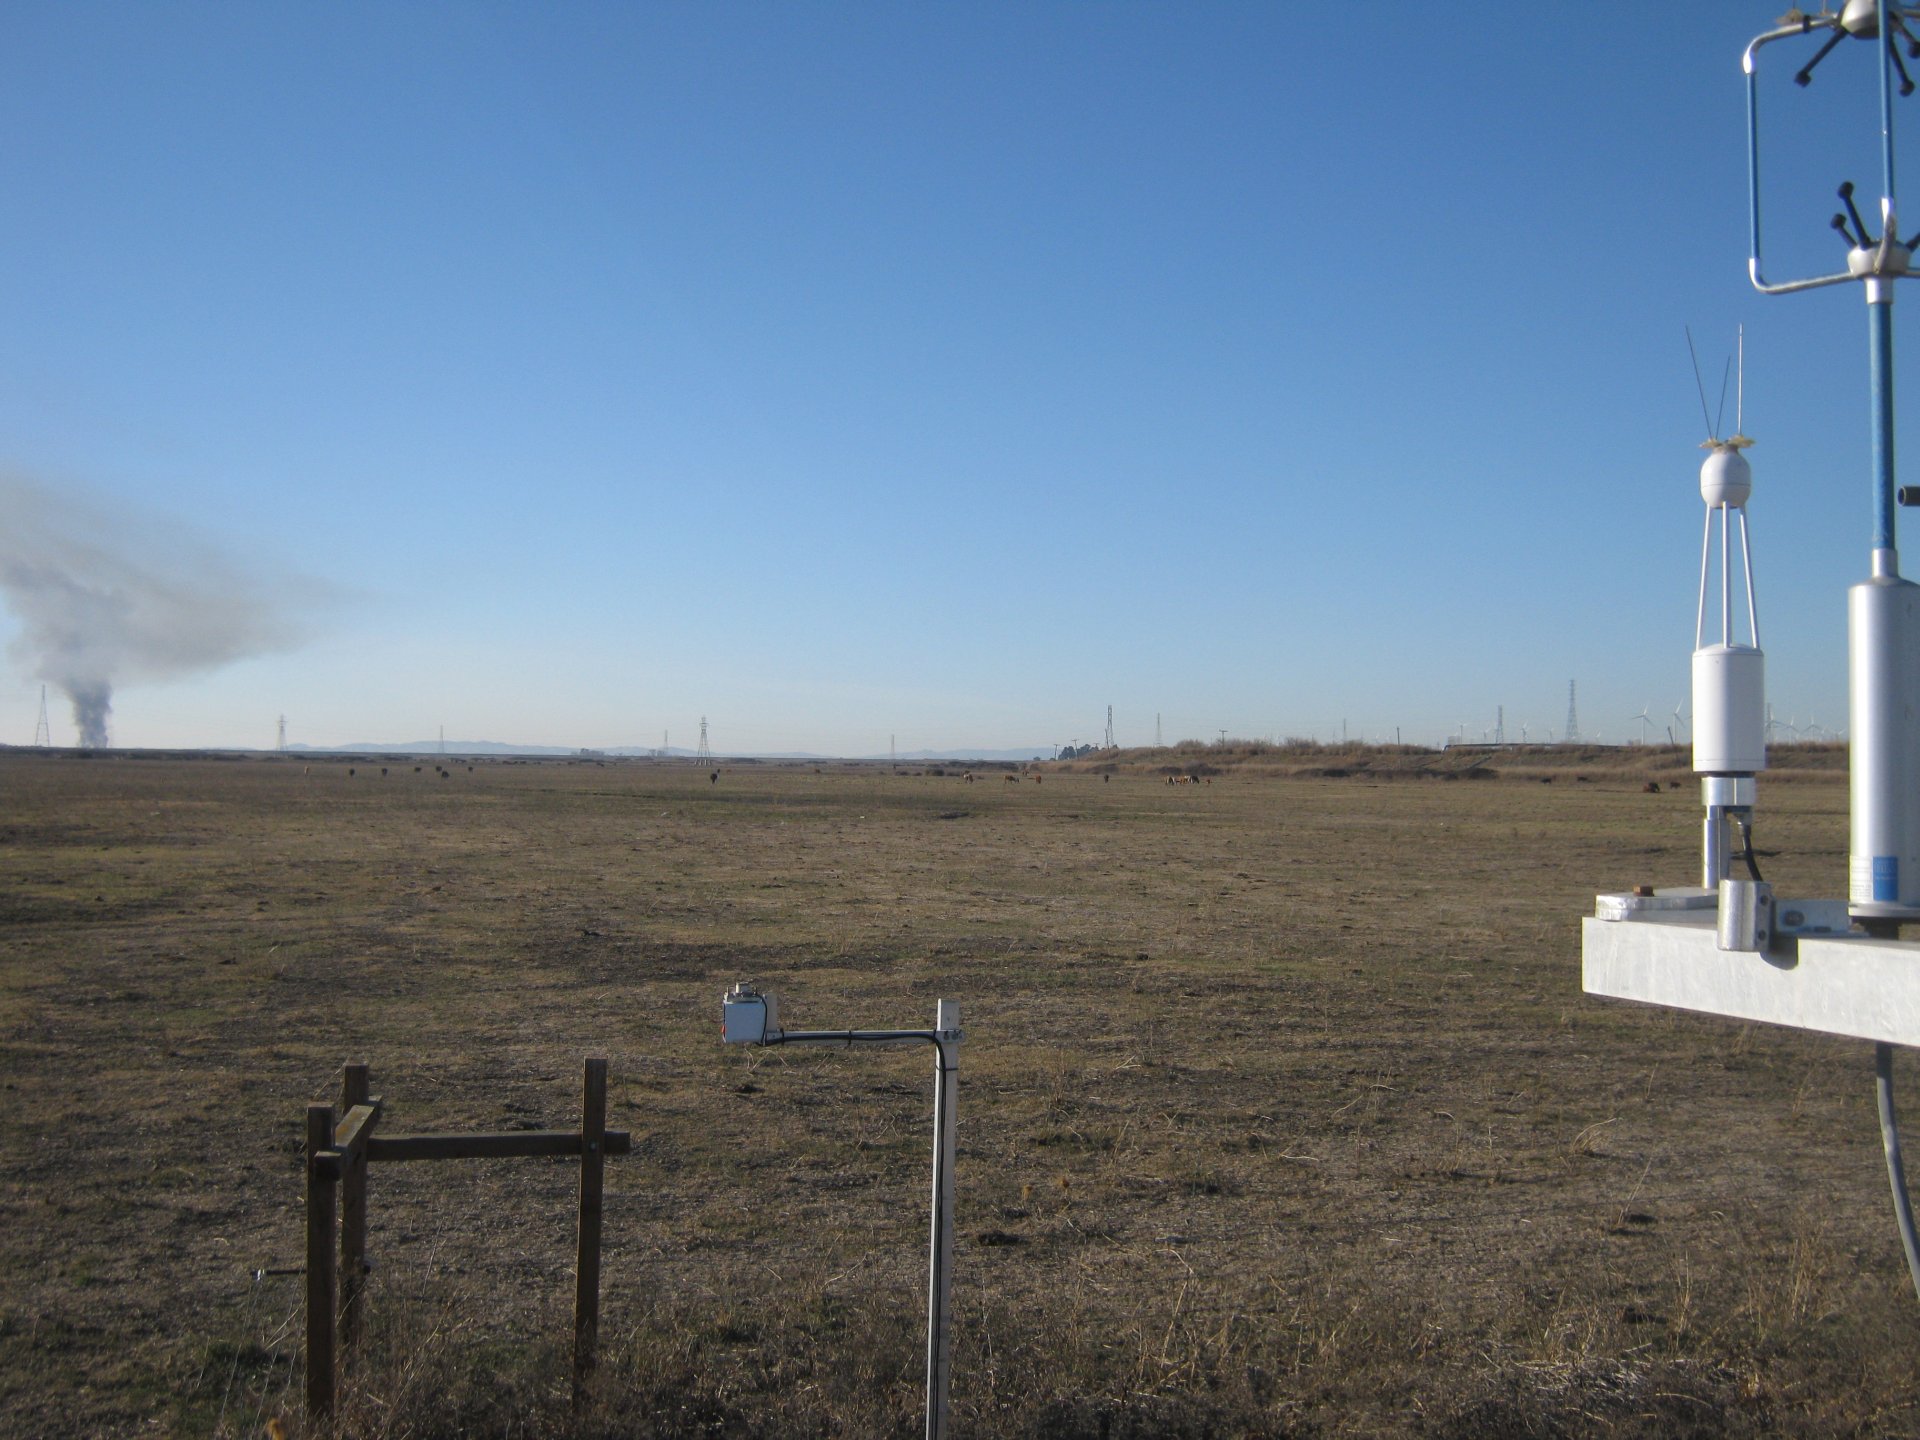
SI_autocam_20140122_1545.jpg ( 2014-01-22 15:45:02 ) Full size: 1920x1440
Fire upwind
7 sets found
No data found for SI_mp.
11 SI_met graphs found
Can't check SI_mixed
2 SI_mixed graphs found
4 SI_flx graphs found
3 SI_soilco2 graphs found
Can't check TWSI_mixed
Can't check SIMBTWEE_met