Field Notes
<--2014-01-23 13:20:00 | 2014-02-25 15:30:00-->Other sites visited today: Sherman Island | Mayberry | Twitchell Rice | West Pond | Twitchell Alfalfa
Phenocam link: Searching...
East End: 2014-02-05 14:45:00 (DOY 36)
Author: Cove Sturtevant
Others: Sara
Summary: Regular site visit. All well. Took additional soil samples in supposed low carbon site.
| East End Wetland 2014-02-05 We arrived about 12:45 PST. There was a full high altitude cloud cover and it was cool with a very light breeze. The channels and ponds are full of water, but the main vegetation shelves remain dry. In addition to the boardwalk out to our tower, there are sampling boardwalks constructed in our check and the two adjacent checks to the north and south. Go Wyatt. We downloaded data and cleaned the flux and radiation instruments. 7500 readings: CO2 = 16.8 mmol m-3 (17.1 after cleaning) H2O = 408 mmol m-3 (same after cleaning) Diag: 249 (same after cleaning) t = 16 C p = 102.1 kPa 7700 readings: CH4: 1.95 ppm (same after cleaning) RSSI: 49% (75% after cleaning) Topped off the reservoir. MET looked good. After checking the tower, Sara and I mosied to the check directly to the south of the permanent tower to take additional soil samples. None of the possible portable tower locations we sampled in December seemed to have as low of soil carbon content as indicated on the map, so we decided to sample this additional location which appeared to have low soil carbon. We took 10 samples in the same format as in December along with GPS locations. |
2 photos found

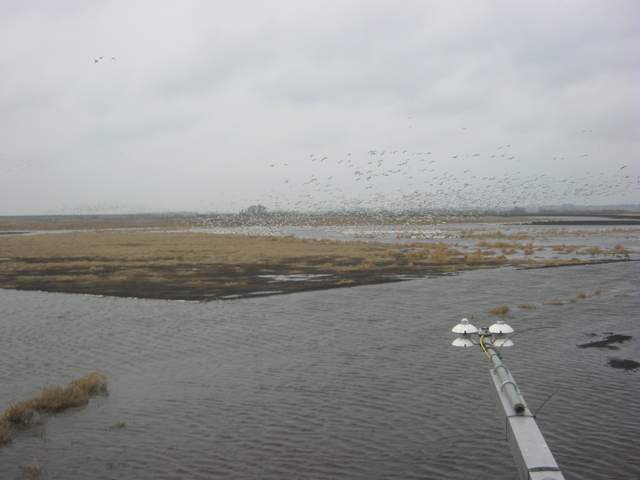
EE_autocam_20140206_1045.jpg ( 2014-02-06 10:45:03 ) Full size: 1920x1440
Geese

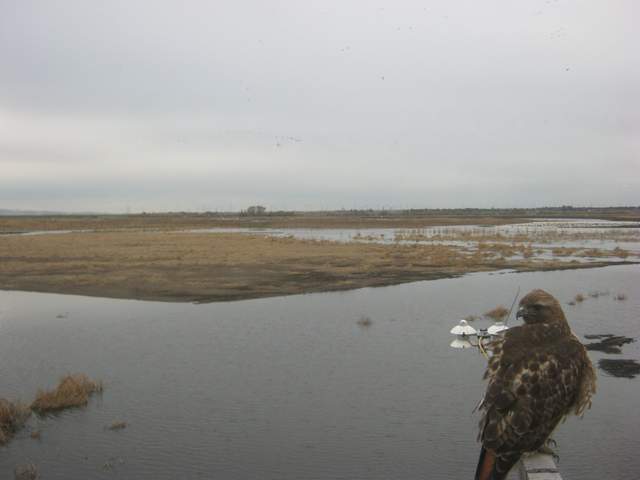
EE_autocam_20140205_1645.jpg ( 2014-02-05 16:45:03 ) Full size: 1920x1440
Hawk
11 sets found
14 EE_met graphs found
Can't check EE_mixed
1 EE_mixed graphs found
8 EE_flux graphs found
Can't check MBWPEESWGT_mixed
1 EE_cam graphs found
Can't check MBEEWPSWEPGT_cam
Can't check SIMBTWEE_met
Can't check EE_Temp
5 EE_Temp graphs found
Can't check EE_minidot
1 EE_minidot graphs found
Can't check MBSWEEWPBCBA
1 EE_processed graphs found

