Field Notes

<--2013-11-27 10:30:00 | 2014-01-07 09:00:00-->
Phenocam link: Searching...

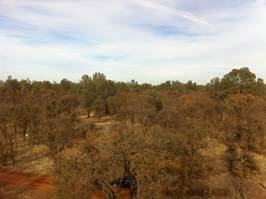
Tonzi: 2013-12-17 10:00:00 (DOY 351)
Author: Siyan Ma
Others:

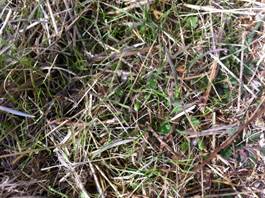
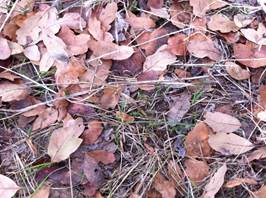
Summary: Annual grasses germinated under litters. Oak leaves fell. I met Mr. Tonzi, Tried to reinstall tower profile pump, LED filter lost.


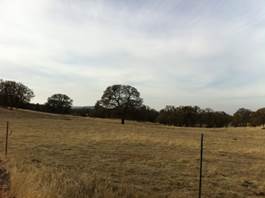
When: Date: 12/17/2013 , Day: 351 , Watch Time: 10:00 am
Where: Tonzi/Vaira Ranch
Who: Siyan
Weather: cloudy
Phenology: Annual grasses germinated under litters. Oak leaves fell. I met Mr. Tonzi. A lot cow poops around Vaira tower. Vaira is heavily grazed. Email to Mr. Varia to get his management information, but no responses.

Grass sprouting through dead grassView of the Vaira pastureDead oak leaves on the groundView of the oak from part way up the tower

Summary
  1. Checked and downloaded data from PC at Tower, Floor, and Vaira
  2. Swapped memory cards of CR1000s at three sites. Everything worked well.
  3. Swapped memory cards of facing-up cameras.
  4. Reinstall the pump in the CO2 profile system; not working properly.
  5. The cover of Tonzi NDVI sensor was broken.
  6. Read dendrometers (not all)
  7. Measured soil moisture
  8. Measure groundwater well:


Date

DOY

Location

Depth without the black thing (feet)

12/17/2013

311

Floor

31.9


Tower

37.7


Roadside

39.7

Vaira_Grass Site
  1. Fence and gate power: 12 v.
  2. Panel and Batteries: - v; - amps; - amps.
  3. downloaded Phenocam images
  4. swapped the memory cards of CR1000.
  5. Check the fans of air temp and relative humidity sensors at Vaira. YES!
  6. Met and soil CO2 profile data:

Screen shot of Vaira met data logger table
Screen shot of Vaira soil co2 data logger table
  1. Check levels of Radiation sensors, clear up surfaces.YES!
  2. Check rain gage, make sure not clogged. YES!
  3. Closed gate and set up fence. YES!
  4. Grass litter height (cm):

Tonzi_Tower Site

  1. Fence and gate power: 12 v.
  2. Panel and Batteries: - v; - amps; - amps.
  3. Reading from Gillsonic screen before downloading data. (The value of H2O and CO2 should be in the range of 0 – 5 v.)
  4. downloaded data from PC and swapped the memory cards of CR1000.
  5. check the fans of air temp. and relative humidity sensors on the tower and the floor. YES!
  6. Check rain gage, make sure not clogged. YES!
  7. Check calibration cylinders:

CO2 tank

404.02ppm

500

18psi

N2

1200

10

Is the pump running‌ Reinstall it; it ran, but air flow was very low. Not working properly. With N2 on, it looked like:
Screen shot of Li-800 calibration span pre-cal
8. close gate and set up fence. YES!
Toniz_Floor Site
  1. Fence and gate power: 12 v.
  2. Panel and Batteries: - v; - amps; - amps.
  3. Reading from Gillsonic screen before downloading data. (The value of H2O and CO2 should be in the range of 0 – 5 v.)

Floor Gill sonic plots screen before downloading data

Screen shot of floor flux data logger table
  1. downloading data from PC. YES!
  2. Swapped the memory cards of CR1000.
  3. Check MD-9 system connections YES!

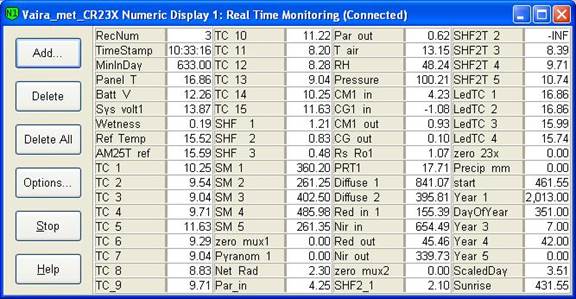
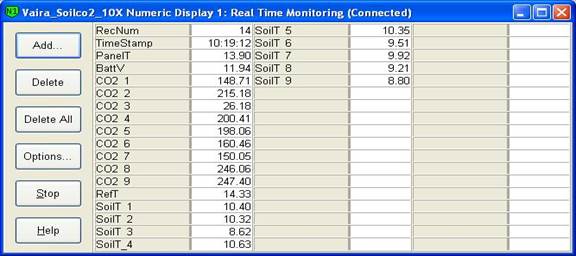
CR23X3 – floor-Met
CR23X6 – tower-Met
CR10X2 – floor-Met
Soil CO2 profile: CR23X5 – soil CO2 profile
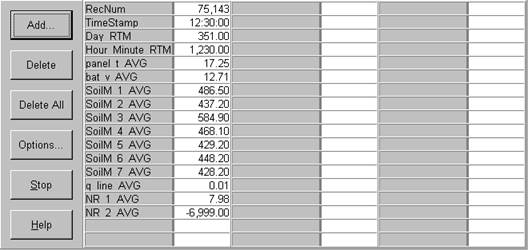
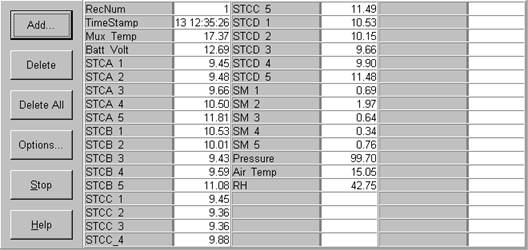
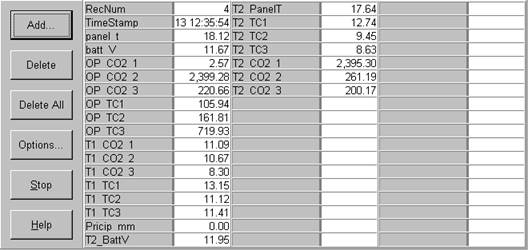
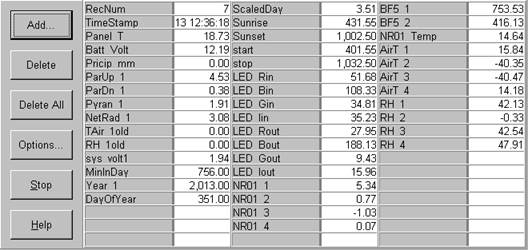
Screen shot of soil moisture data logger table

Screen shot of floor met data logger table

Screen shot of soil co2 data logger table

Screen shot of tower met data logger table
  1. Close gate and set up fence. YES!

Field Data

No tank data

No TZ Well data found

No TZ Moisture Point data found

No VR Moisture Point data found

No TZ grass heigth found

No VR grass heigth found

Tree DBH

DateTag#Reading (mm)
2013-12-1710222.6
2013-12-17218.5
2013-12-17320.6

No water potential data found

No TZ Grass Biomass data found

No TZ OakLeaves Biomass data found

No TZ PineNeedles Biomass data found

0 photos found

Graphs display:
16 sets found

No data found for TZ_Fenergy.
11 TZ_tmet graphs found

Explore the graph:Tonzi Tower Met: Temperature and Power in a new window

Explore the graph:Tonzi Tower Met: Solar Radiation in a new window

Explore the graph:Tonzi Tower Met: IRT Sensors in a new window

Explore the graph:LED Sensor Incoming in a new window

Explore the graph:LED Sensor Outgoing in a new window

Explore the graph:4-Band Solar Radiation in a new window

Explore the graph:Air Temperature Profile in a new window

Explore the graph:Relativity Humidity Profile in a new window

Explore the graph:Tonzi Tower PRI in a new window

Explore the graph:SRS PRI/NDVI in a new window

Explore the graph:SRS NDVI in a new window

11 TZ_soilco2 graphs found

Explore the graph:Tonzi Soil CO2 Profile: Open (East) CO2 in a new window

Explore the graph:Tonzi Soil CO2 Profile: Tree (West) CO2 in a new window

Explore the graph:Tonzi Soil CO2 Profile: Open (East) Temperatures in a new window

Explore the graph:Tonzi Soil CO2 Profile: Tree (West) Temperatures in a new window

Explore the graph:Tonzi Soil CO2 Profile: Upper CO2 in a new window

Explore the graph:Tonzi Soil CO2 Profile: Lower CO2 in a new window

Explore the graph:Tonzi Soil CO2 Profile: Upper Temperatures in a new window

Explore the graph:Tonzi Soil CO2 Profile: Lower Temperatures in a new window

Explore the graph:Tonzi Soil CO2 Profile: Power and Temperature in a new window

Explore the graph:Tree 2 Soil CO2 in a new window

Explore the graph:Tree 2 Soil Temperature in a new window

Can't check TZ_mixed
3 TZ_mixed graphs found

Explore the graph:Tonzi PPT in a new window

Explore the graph:Tonzi CO2 and H2O Densities in a new window

Explore the graph:Air Pressure in a new window

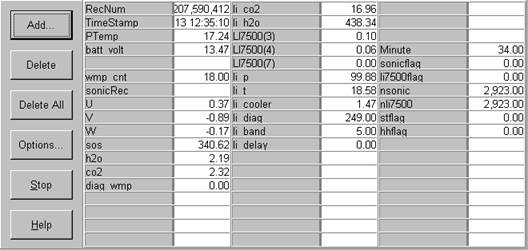
1 TZ_fflux graphs found

Explore the graph:Tonzi Wind Speed in a new window

8 TZ_fmet graphs found

Explore the graph:Soil Heat Flux in a new window

Explore the graph:Tonzi Soil Temperature Set A in a new window

Explore the graph:Tonzi Soil Temperatures Set B in a new window

Explore the graph:Tonzi Soil Temperatures Set C in a new window

Explore the graph:Tonzi Soil Temperature Set D in a new window

Explore the graph:Well Level in a new window

Explore the graph:Well Water Temperature in a new window

Explore the graph:Soil Water Potential in a new window

1 TZ_tram graphs found

Explore the graph:Tonzi Tram Incoming PAR in a new window

No data found for TZ_co2prof.
No data found for TZ_irt.
No data found for TZ_windprof.
1 TZ_tflux graphs found

Explore the graph:Tower CO2 and H2O in a new window

2 TZ_sm graphs found

Explore the graph:Floor Solar Radiations in a new window

Explore the graph:TZ Soil Moisture in a new window

Can't check TZ_met
1 TZ_met graphs found

Explore the graph:Floor and Tower RH in a new window

Can't check TZVR_mixed
8 TZ_osu graphs found

Explore the graph:Soil Moisture And Rain in a new window

Explore the graph:SP1 Solar Radiation in a new window

Explore the graph:SP1 Soil Temperature Profile in a new window

Explore the graph:SP1 Soil Heat Flux in a new window

Explore the graph:SP2 Soil Moisture in a new window

Explore the graph:SP2 Soil Temperature in a new window

Explore the graph:SP3 Soil Moisture in a new window

Explore the graph:SP3 Soil Temperature in a new window

No data found for TZ_fd.
Tonzi Z-cam data

plot of Tonzi z-cam LAI

plot of Tonzi z-cam gap fration