
Field Notes
<--2013-12-17 10:00:00 | 2014-01-07 10:45:00-->Other sites visited today: Vaira | Tonzi
Phenocam link: Searching...
Tonzi: 2014-01-07 09:00:00 (DOY 7)
Author: Siyan Ma
Others: Joe
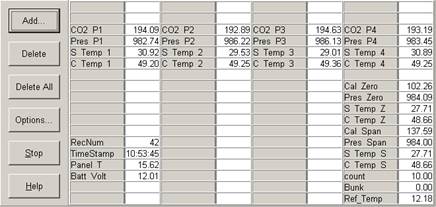
Summary: Standard fieldwork, tested wireless data transfer at Vaira, fixed CO2 profile
|
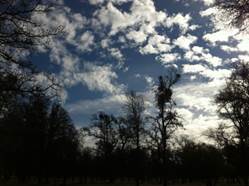
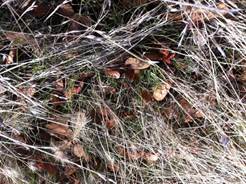
When: Date: 1/7/20134 , Day: 7 , Watch Time: 9:00 am . Where: Tonzi/Vaira Ranch Who: Siyan, Joe Weather: clear, partially cloud Phenology: No rain yet since November. Grasses were germinated and looked not bad under the litters. Weather forecast said that the dry condition would continue.
Summary
Vaira_Grass Site
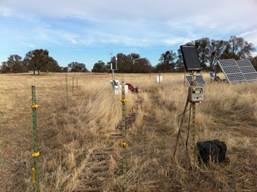
Tonzi_Tower Site
Toniz_Floor Site
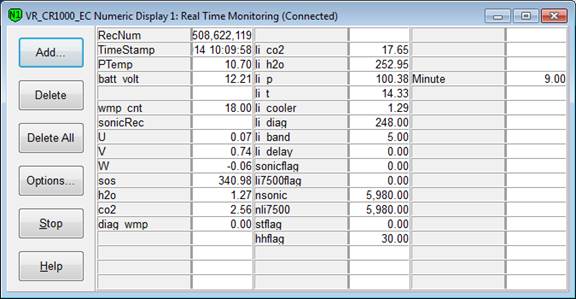
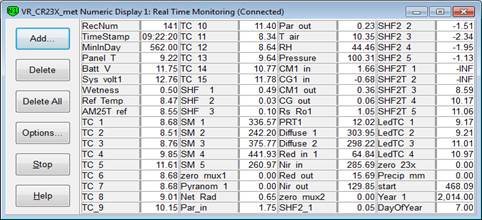
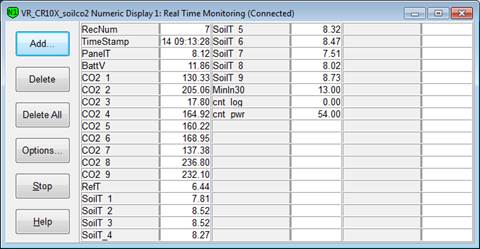
CR23X3 – floor-Met CR23X6 – tower-Met CR10X2 – floor-Met Soil CO2 profile: CR23X5 – soil CO2 profile 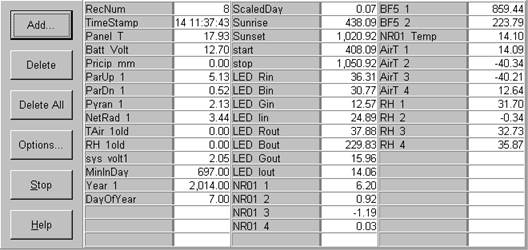 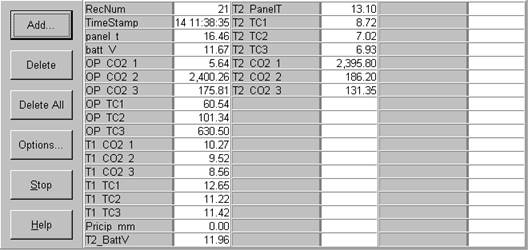  
|
Field Data
No tank data
Well Depth
| Date | Location | Depth (feet) |
|---|---|---|
| 2014-01-07 | TZ_floor | 32 |
| 2014-01-07 | TZ_road | 39.8 |
| 2014-01-07 | TZ_tower | 37.8 |
mode = both
Moisture Point Probes TZ
Array
(
[0] => Tower_1
[1] => Floor_South_1
[2] => Floor_West_1
[3] => SoilCO2_1
[4] => Soil_Transect_4_1
[5] => Soil_Transect_3_1
[6] => Soil_Transect_2_1
[7] => Soil_Transect_1_1
[8] => SoilCO2_West_A_1
[9] => SoilCO2_West_B_1
[10] => SoilCO2_West_C_1
[11] => Tower_2
[12] => Floor_South_2
[13] => Floor_East_2
[14] => Floor_West_2
[15] => SoilCO2_2
[16] => Soil_Transect_4_2
[17] => Soil_Transect_3_2
[18] => Soil_Transect_2_2
[19] => Soil_Transect_1_2
[20] => SoilCO2_West_A_2
[21] => SoilCO2_West_B_2
[22] => SoilCO2_West_C_2
[23] => Tower_3
[24] => Floor_South_3
[25] => Floor_East_3
[26] => Floor_West_3
[27] => SoilCO2_3
[28] => Soil_Transect_4_3
[29] => Soil_Transect_3_3
[30] => Soil_Transect_2_3
[31] => Soil_Transect_1_3
[32] => SoilCO2_West_A_3
[33] => SoilCO2_West_B_3
[34] => SoilCO2_West_C_3
[35] => Floor_South_4
[36] => Floor_East_4
[37] => Floor_West_4
[38] => SoilCO2_4
[39] => Soil_Transect_4_4
[40] => Soil_Transect_3_4
[41] => Soil_Transect_2_4
[42] => Soil_Transect_1_4
[43] => SoilCO2_West_A_4
[44] => SoilCO2_West_B_4
[45] => SoilCO2_West_C_4
)
| Date | DOY | Rep | Depth | Tower_1 |
Floor_South_1 |
Floor_West_1 |
SoilCO2_1 |
Soil_Transect_4_1 |
Soil_Transect_3_1 |
Soil_Transect_2_1 |
Soil_Transect_1_1 |
SoilCO2_West_A_1 |
SoilCO2_West_B_1 |
SoilCO2_West_C_1 |
Tower_2 |
Floor_South_2 |
Floor_East_2 |
Floor_West_2 |
SoilCO2_2 |
Soil_Transect_4_2 |
Soil_Transect_3_2 |
Soil_Transect_2_2 |
Soil_Transect_1_2 |
SoilCO2_West_A_2 |
SoilCO2_West_B_2 |
SoilCO2_West_C_2 |
Tower_3 |
Floor_South_3 |
Floor_East_3 |
Floor_West_3 |
SoilCO2_3 |
Soil_Transect_4_3 |
Soil_Transect_3_3 |
Soil_Transect_2_3 |
Soil_Transect_1_3 |
SoilCO2_West_A_3 |
SoilCO2_West_B_3 |
SoilCO2_West_C_3 |
Floor_South_4 |
Floor_East_4 |
Floor_West_4 |
SoilCO2_4 |
Soil_Transect_4_4 |
Soil_Transect_3_4 |
Soil_Transect_2_4 |
Soil_Transect_1_4 |
SoilCO2_West_A_4 |
SoilCO2_West_B_4 |
SoilCO2_West_C_4 |
Avg | Spacial Count |
Measurement Count |
|---|---|---|---|---|---|---|---|---|---|---|---|---|---|---|---|---|---|---|---|---|---|---|---|---|---|---|---|---|---|---|---|---|---|---|---|---|---|---|---|---|---|---|---|---|---|---|---|---|---|---|---|---|
| 2014-01-07 | 7 | 0 | nan | 7.4 | 4.2 | 13 | 9.4 | 9.7 | 29.7 | 7.1 | 6.2 | 10 | 12.4 | 5 | 12.4 | 7.8 | 14.2 | 10.9 | 12.1 | 9.7 | 19.1 | -2.7 | 3.2 | 12.1 | 2.3 | 14.5 | 18.7 | 10.3 | 10.9 | 12 | 6.2 | 8.7 | 11.1 | 14.5 | 13.1 | 15.4 | 14.8 | 13.4 | 1.3 | 14.2 | 14.8 | 19.9 | 9 | 16.5 | 20.2 | 10.5 | 12.5 | 7.9 | 9.6 | |||
| 2014-01-07 | 7 | 1 | nan | 6 | 4.2 | 13.8 | 8.8 | 9.4 | 30.9 | 6.8 | 6.5 | 13 | 8.1 | 14.8 | 10.6 | 12.1 | 9.3 | 18.8 | 13.6 | 2.9 | 18.2 | 10.9 | 9.8 | 11.2 | 5.3 | 8.4 | 11.1 | 15.1 | 13.1 | 1.2 | 13.9 | 13 | 19.3 | 10.5 | 15.9 | 20.5 | 9.3 | |||||||||||||||
| 2014-01-07 | 7 | Avg | 0-15cm | 0 | 0 | |||||||||||||||||||||||||||||||||||||||||||||||
| 2014-01-07 | 7 | Avg | 15-30cm | 0 | 0 | |||||||||||||||||||||||||||||||||||||||||||||||
| 2014-01-07 | 7 | Avg | 30-45cm | 0 | 0 | |||||||||||||||||||||||||||||||||||||||||||||||
| 2014-01-07 | 7 | Avg | 45-60cm | 0 | 0 |
mode = both
Moisture Point Probes VR
Array
(
[0] => Solar_Panels_1
[1] => Flux_Tower_1
[2] => Gate_1
[3] => Biomass_Cage_1
[4] => Solar_Panels_2
[5] => Flux_Tower_2
[6] => Gate_2
[7] => Biomass_Cage_2
[8] => Solar_Panels_3
[9] => Flux_Tower_3
[10] => Gate_3
[11] => Biomass_Cage_3
[12] => Solar_Panels_4
[13] => Flux_Tower_4
[14] => Gate_4
[15] => Biomass_Cage_4
)
| Date | DOY | Rep | Depth | Solar_Panels_1 |
Flux_Tower_1 |
Gate_1 |
Biomass_Cage_1 |
Solar_Panels_2 |
Flux_Tower_2 |
Gate_2 |
Biomass_Cage_2 |
Solar_Panels_3 |
Flux_Tower_3 |
Gate_3 |
Biomass_Cage_3 |
Solar_Panels_4 |
Flux_Tower_4 |
Gate_4 |
Biomass_Cage_4 |
Avg | Spacial Count |
Measurement Count |
|---|---|---|---|---|---|---|---|---|---|---|---|---|---|---|---|---|---|---|---|---|---|---|
| 2014-01-07 | 7 | 0 | nan | 5.3 | 9.7 | 5.6 | 2.7 | 15.2 | 10 | 10.6 | 8.1 | 13.1 | 2.8 | 10.6 | 13.4 | 22.8 | 9.6 | 5 | 11.3 | |||
| 2014-01-07 | 7 | 1 | nan | 4.7 | 8.6 | 4.5 | 2.4 | 13.6 | 10.3 | 11.2 | 8.4 | 12.8 | 2.3 | 11.2 | 13.4 | 22.8 | 10.2 | 5.3 | 11.6 | |||
| 2014-01-07 | 7 | Avg | 0-15cm | 0 | 0 | |||||||||||||||||
| 2014-01-07 | 7 | Avg | 15-30cm | 0 | 0 | |||||||||||||||||
| 2014-01-07 | 7 | Avg | 30-45cm | 0 | 0 | |||||||||||||||||
| 2014-01-07 | 7 | Avg | 45-60cm | 0 | 0 |
No TZ grass heigth found
No VR grass heigth found
Tree DBH
| Date | Tag# | Reading (mm) |
|---|---|---|
| 2014-01-07 | 1 | 25.1 |
| 2014-01-07 | 102 | 22 |
| 2014-01-07 | 2 | 18.4 |
| 2014-01-07 | 245 | 14.3 |
| 2014-01-07 | 3 | 20.6 |
| 2014-01-07 | 4 | 3.9 |
| 2014-01-07 | 5 | 25 |
| 2014-01-07 | 7 | 18.1 |
| 2014-01-07 | 72 | 16.1 |
| 2014-01-07 | 79 | 21.8 |
| 2014-01-07 | 8 | 9.8 |
No water potential data found
No TZ Grass Biomass data found
No TZ OakLeaves Biomass data found
No TZ PineNeedles Biomass data found
1 photos found
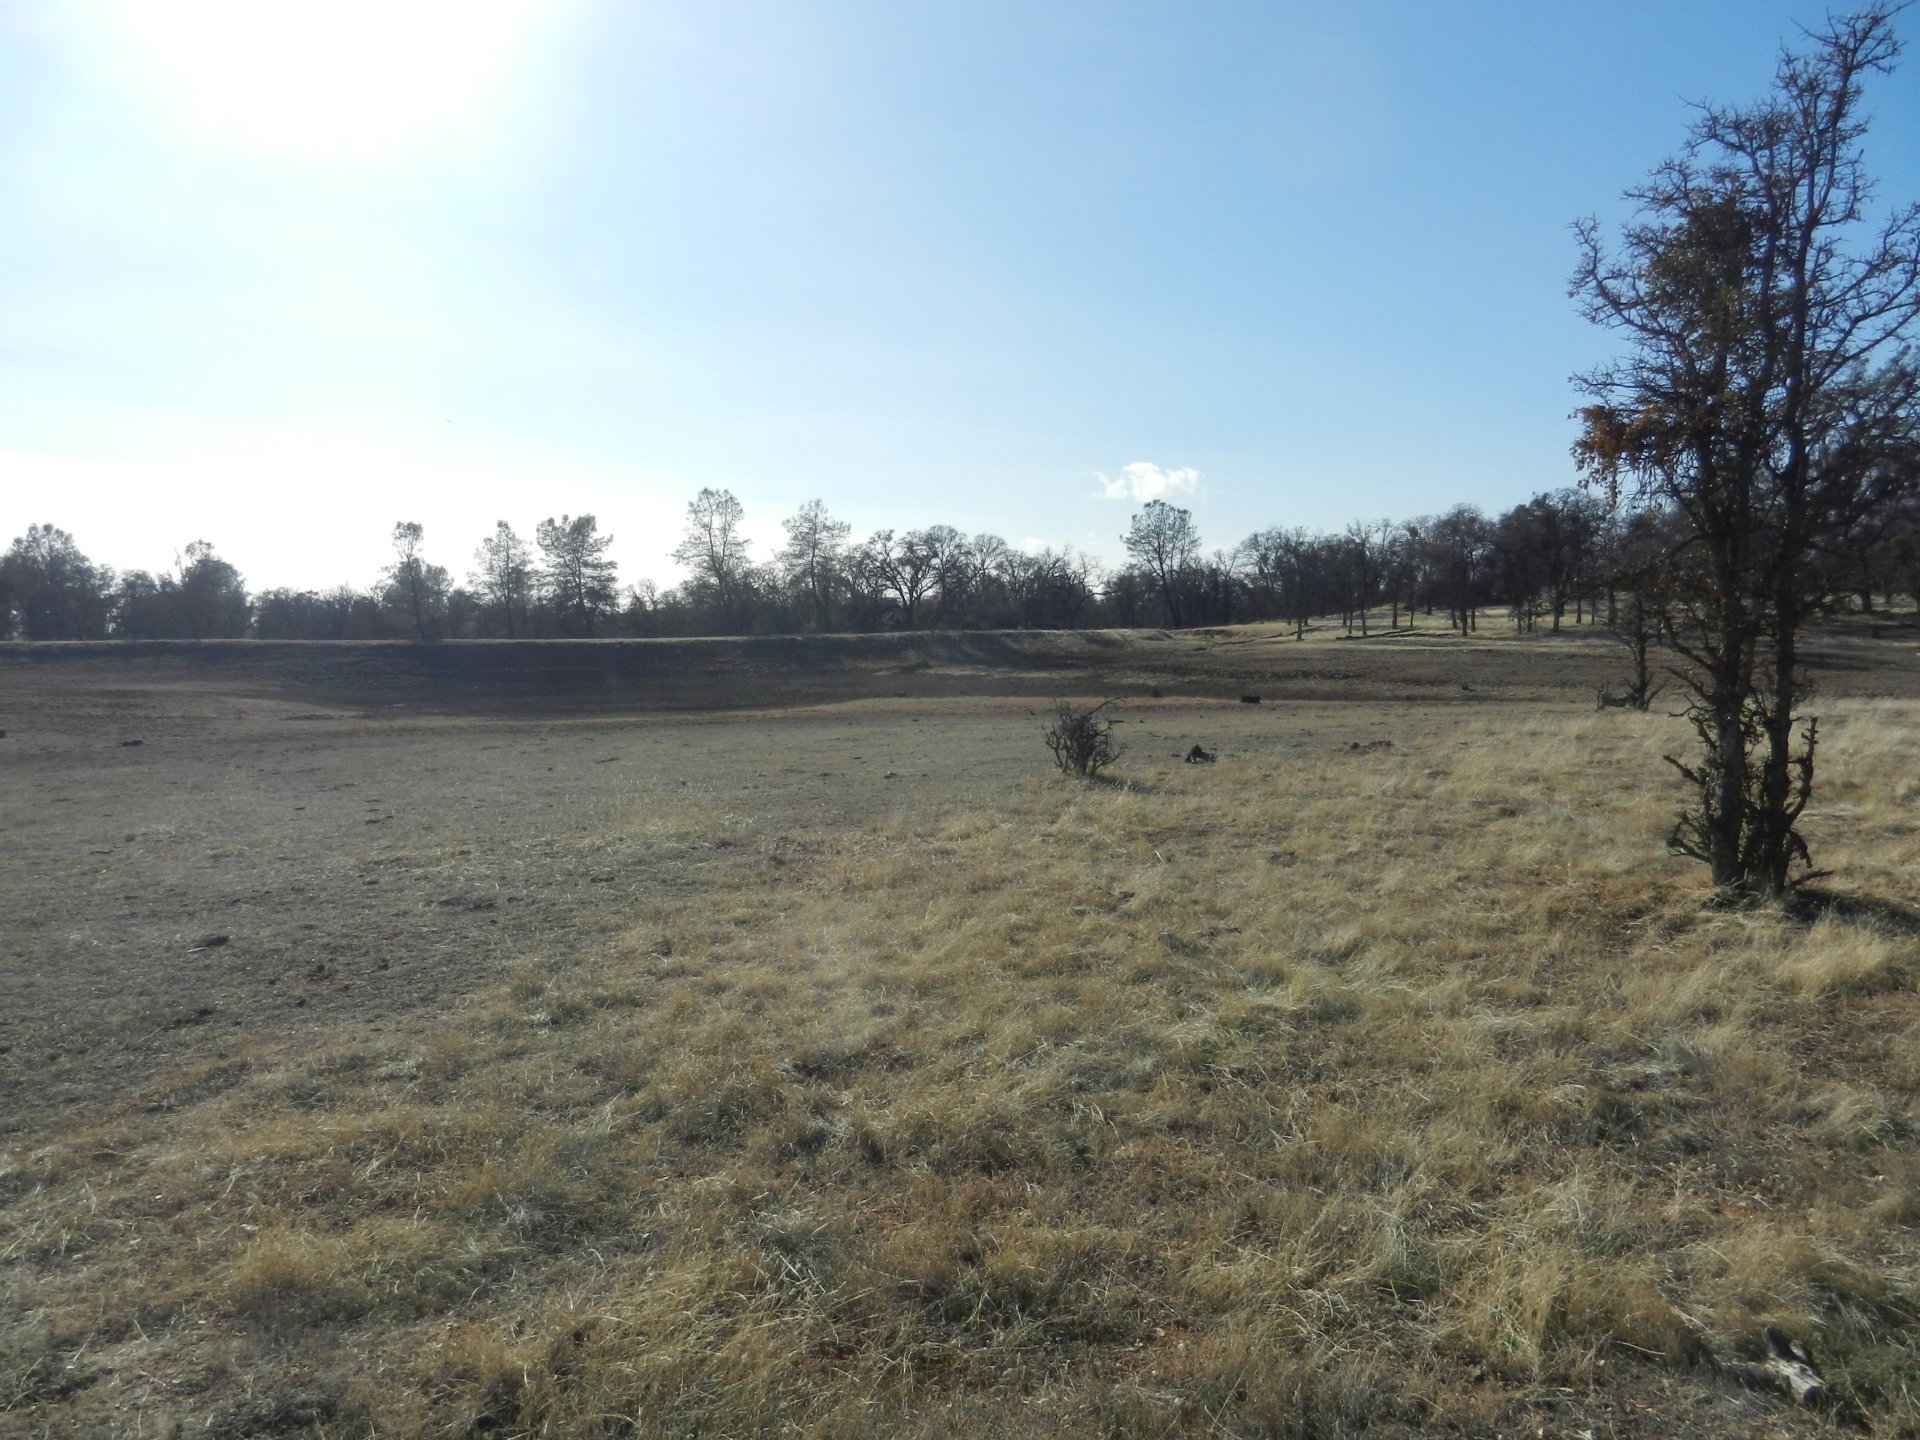
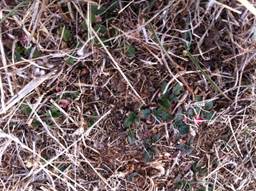
20140107TZ_DryPond.jpg ( 2014-01-07 14:46:23 ) Full size: 1920x1440
The Tonzi pond is nearly dry
16 sets found
No data found for TZ_Fenergy.
11 TZ_tmet graphs found
11 TZ_soilco2 graphs found
Can't check TZ_mixed
3 TZ_mixed graphs found
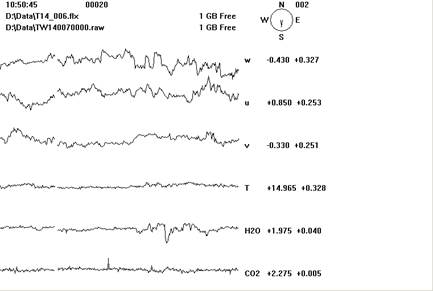
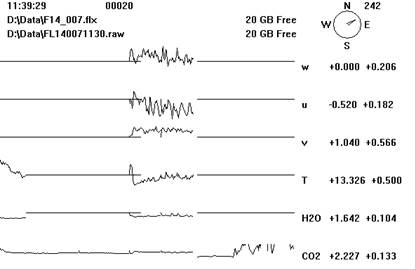
1 TZ_fflux graphs found
8 TZ_fmet graphs found
No data found for TZ_tram.
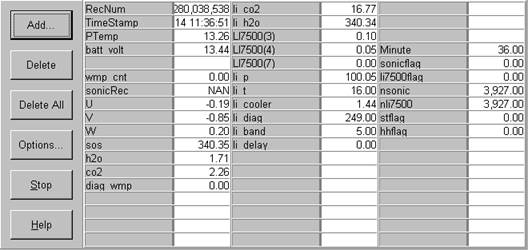
3 TZ_co2prof graphs found
No data found for TZ_irt.
No data found for TZ_windprof.
1 TZ_tflux graphs found
2 TZ_sm graphs found
Can't check TZ_met
1 TZ_met graphs found
Can't check TZVR_mixed
8 TZ_osu graphs found
No data found for TZ_fd.
Tonzi Z-cam data