
Field Notes
<--2013-06-19 09:00:00 | 2013-07-11 09:10:00-->Other sites visited today: Tonzi | Vaira
Phenocam link: Searching...
Tonzi: 2013-06-19 09:30:00 (DOY 170)
Author: Joe Verfaillie
Others: Siyan, Martin, Taichi
Summary: Standard fieldwork, data collection, moved tram
| Tonzi 2013-06-19 I arrived about 9:30 with Siyan, Martin and Taichi. It was clear, sunny and mild (for summer) with a nice breeze. The grass is really yellow and dead, no flowers now. The trees look good. Tonzis pond is as low as I have ever seen it I think. We moved the tram from the cluster up on the hill southwest of the tower to the cluster west of the soil CO2 site. When we arrived the tram had stopped due to a derail near the far end of the track. The move went very well and we saw the tram run one and a half times at the new location before we left. The connection to the tower computer was working and downloaded data from the first run. Siyan did the standard fieldwork plus midday water potential. |
Field Data
No tank data
Well Depth
| Date | Location | Depth (feet) |
|---|---|---|
| 2013-06-19 | TZ_floor | 28.9 |
| 2013-06-19 | TZ_road | 37.3 |
| 2013-06-19 | TZ_tower | 33.2 |
No TZ Moisture Point data found
No VR Moisture Point data found
No TZ grass heigth found
No VR grass heigth found
Tree DBH
| Date | Tag# | Reading (mm) |
|---|---|---|
| 2013-06-19 | 1 | 25 |
| 2013-06-19 | 102 | 20.1 |
| 2013-06-19 | 2 | 18.2 |
| 2013-06-19 | 245 | 13.9 |
| 2013-06-19 | 3 | 21.4 |
| 2013-06-19 | 4 | 4 |
| 2013-06-19 | 5 | 24.5 |
| 2013-06-19 | 7 | 18.2 |
| 2013-06-19 | 72 | 15.5 |
| 2013-06-19 | 79 | 17.4 |
| 2013-06-19 | 8 | 9.1 |
Water Potential - mode: raw
| Time | Species | Tree | readings (bar) | |||
|---|---|---|---|---|---|---|
| 2013-06-19 12:16:00 | OAK | 102 | -40 | -15 | -35 | -27 |
| 2013-06-19 12:16:00 | OAK | 35 | -35 | -39 | -36 | -20 |
| 2013-06-19 12:16:00 | OAK | 92 | -15 | -28 | -32 | |
| 2013-06-19 12:16:00 | PINE | OLD | -15 | -20 | -17 | |
| 2013-06-19 12:16:00 | PINE | YNG | -22 | -12 | -3.5 | -9.5 |
No TZ Grass Biomass data found
No TZ OakLeaves Biomass data found
No TZ PineNeedles Biomass data found
4 photos found
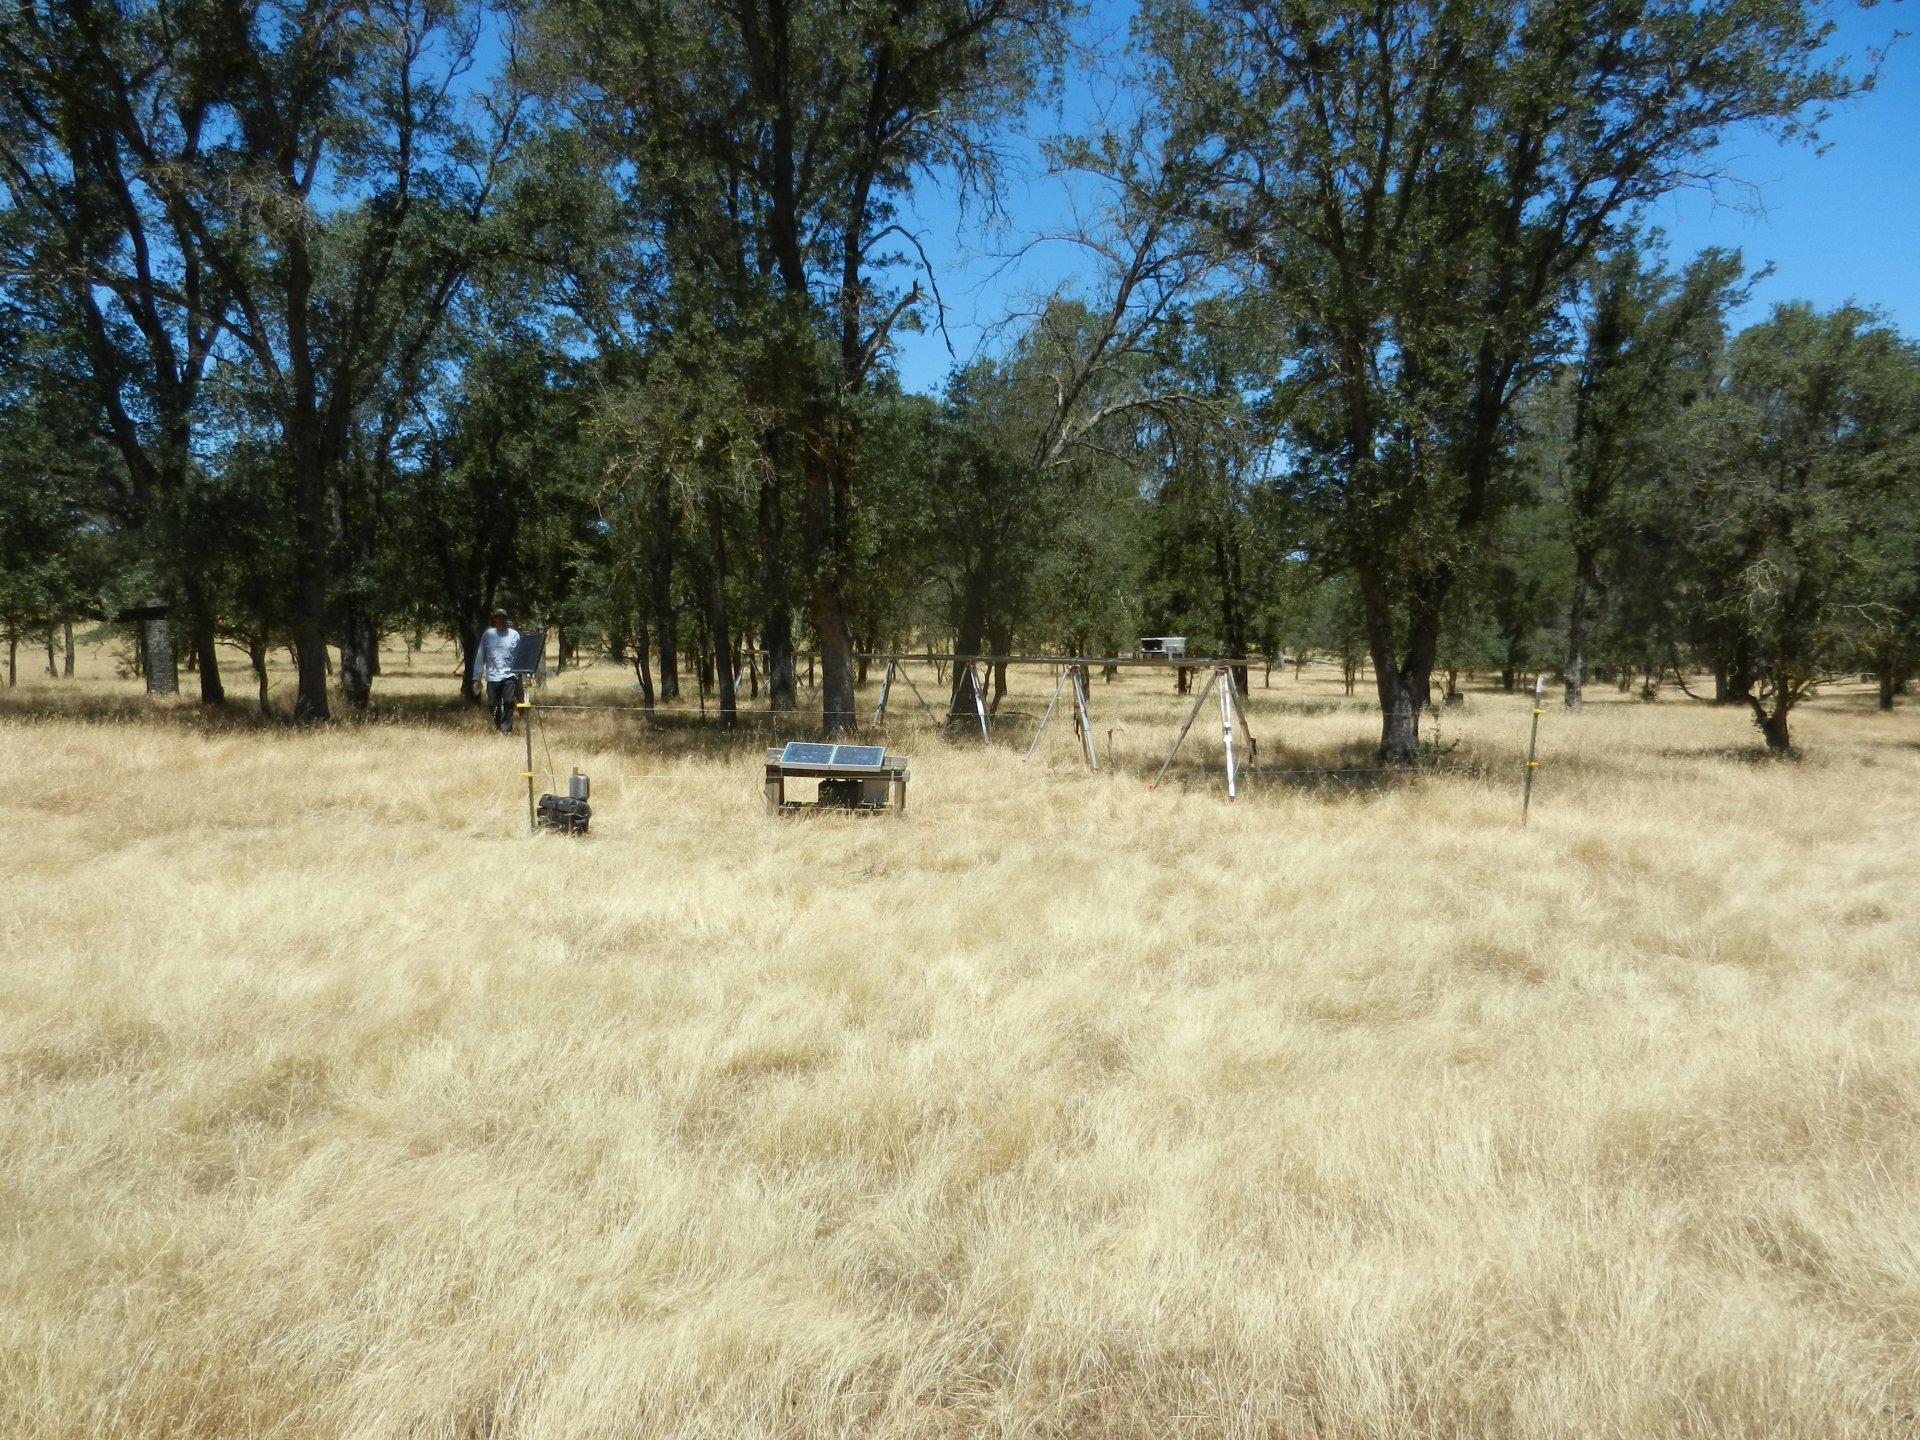
20130619TZ_NewTramLocation2.jpg ( 2013-06-19 12:01:10 ) Full size: 1920x1440
New location for radiometer tram track in the oak woodland
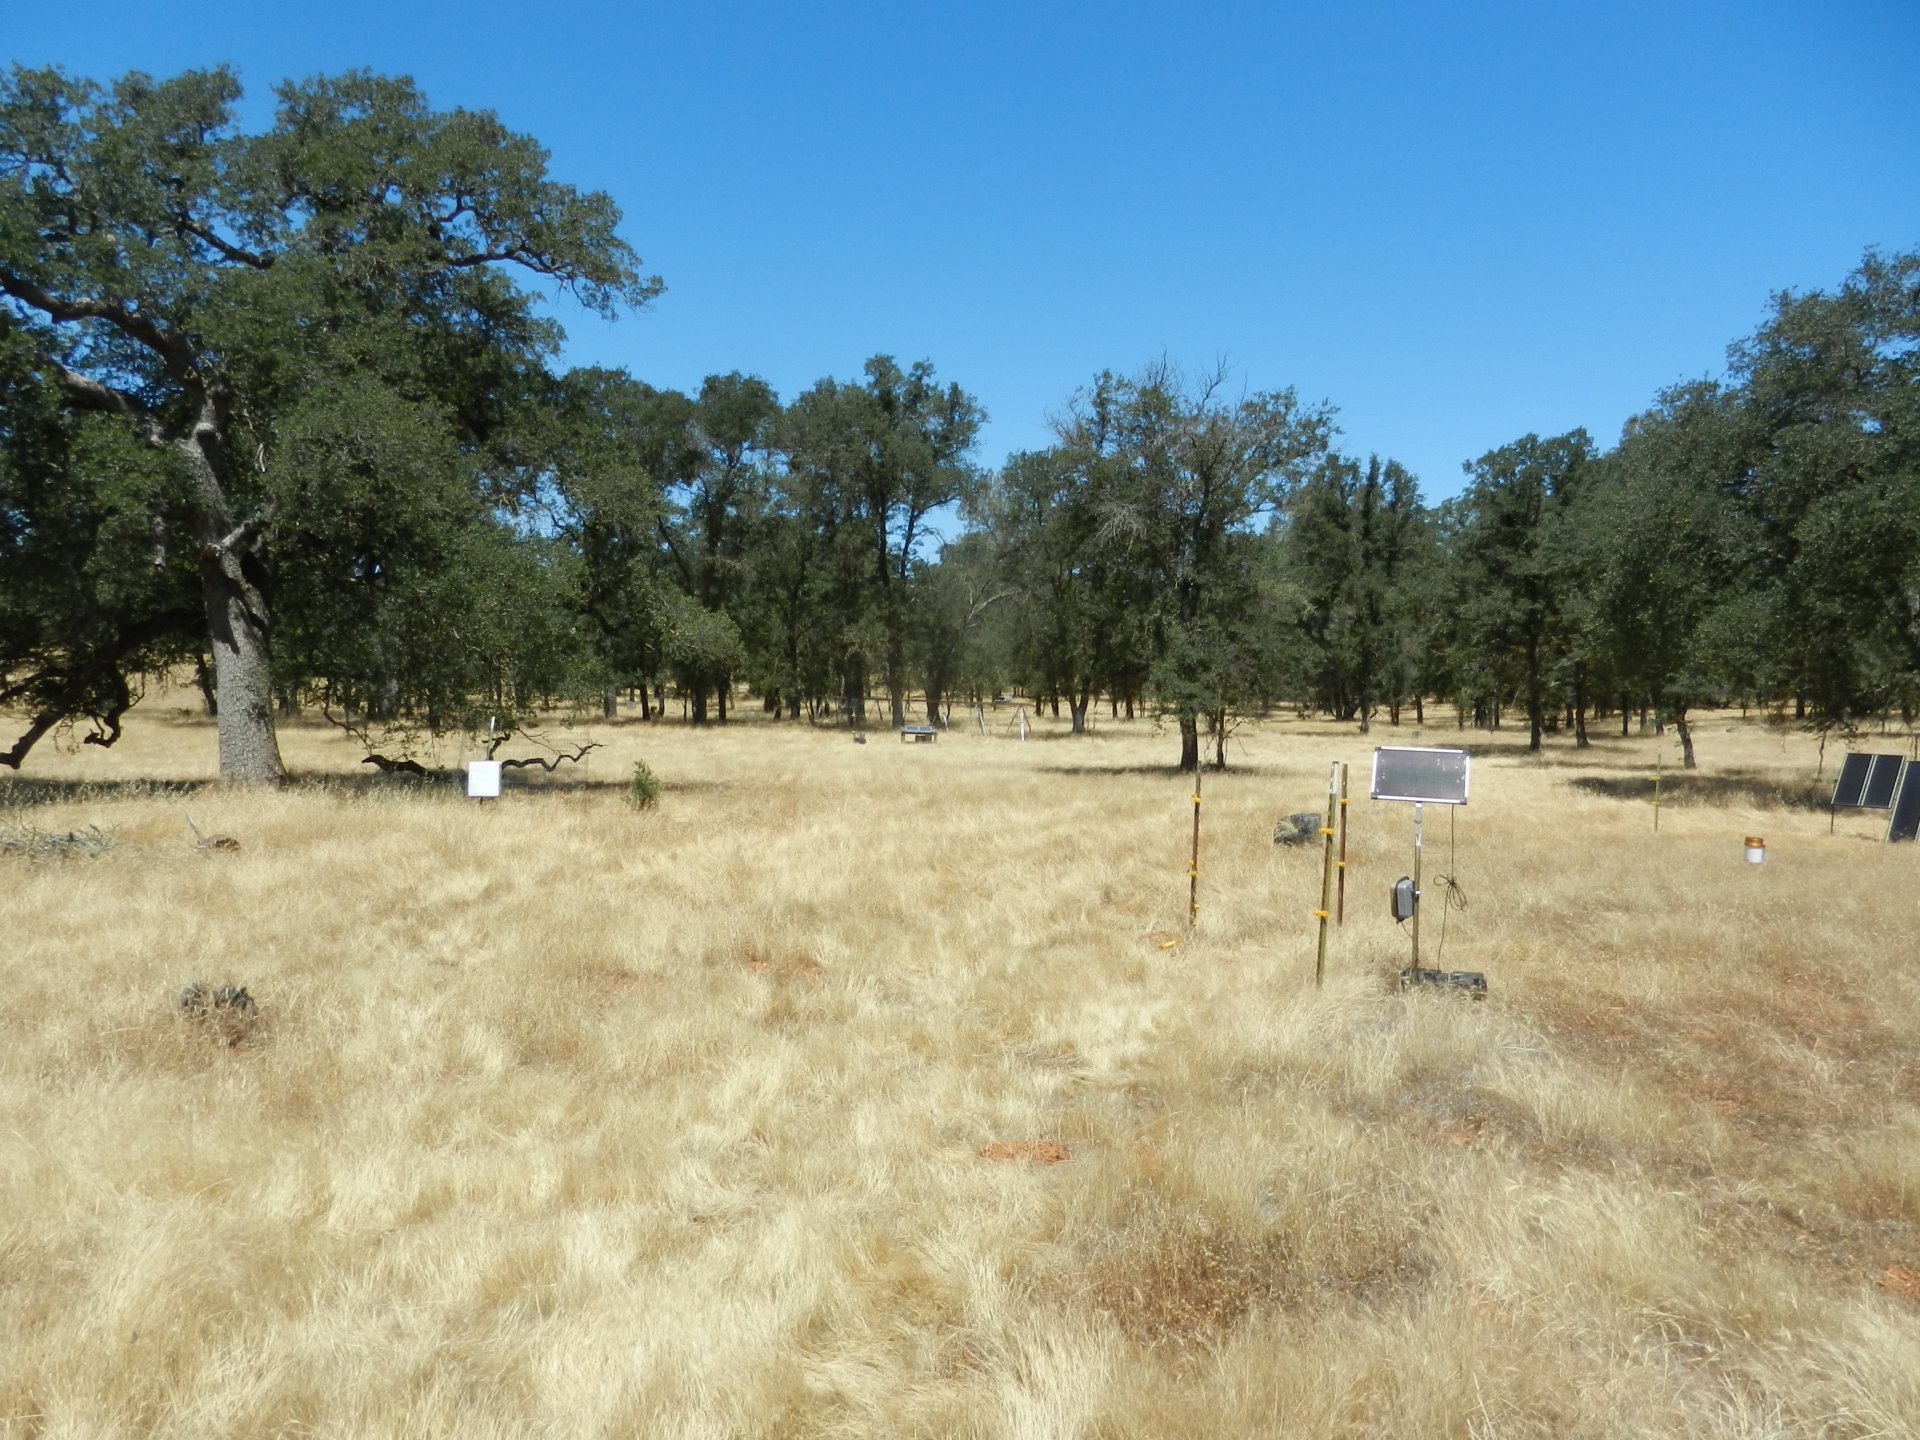
20130619TZ_NewTramLocation1.jpg ( 2013-06-19 11:59:16 ) Full size: 1920x1440
New location for radiometer tram track in the oak woodland
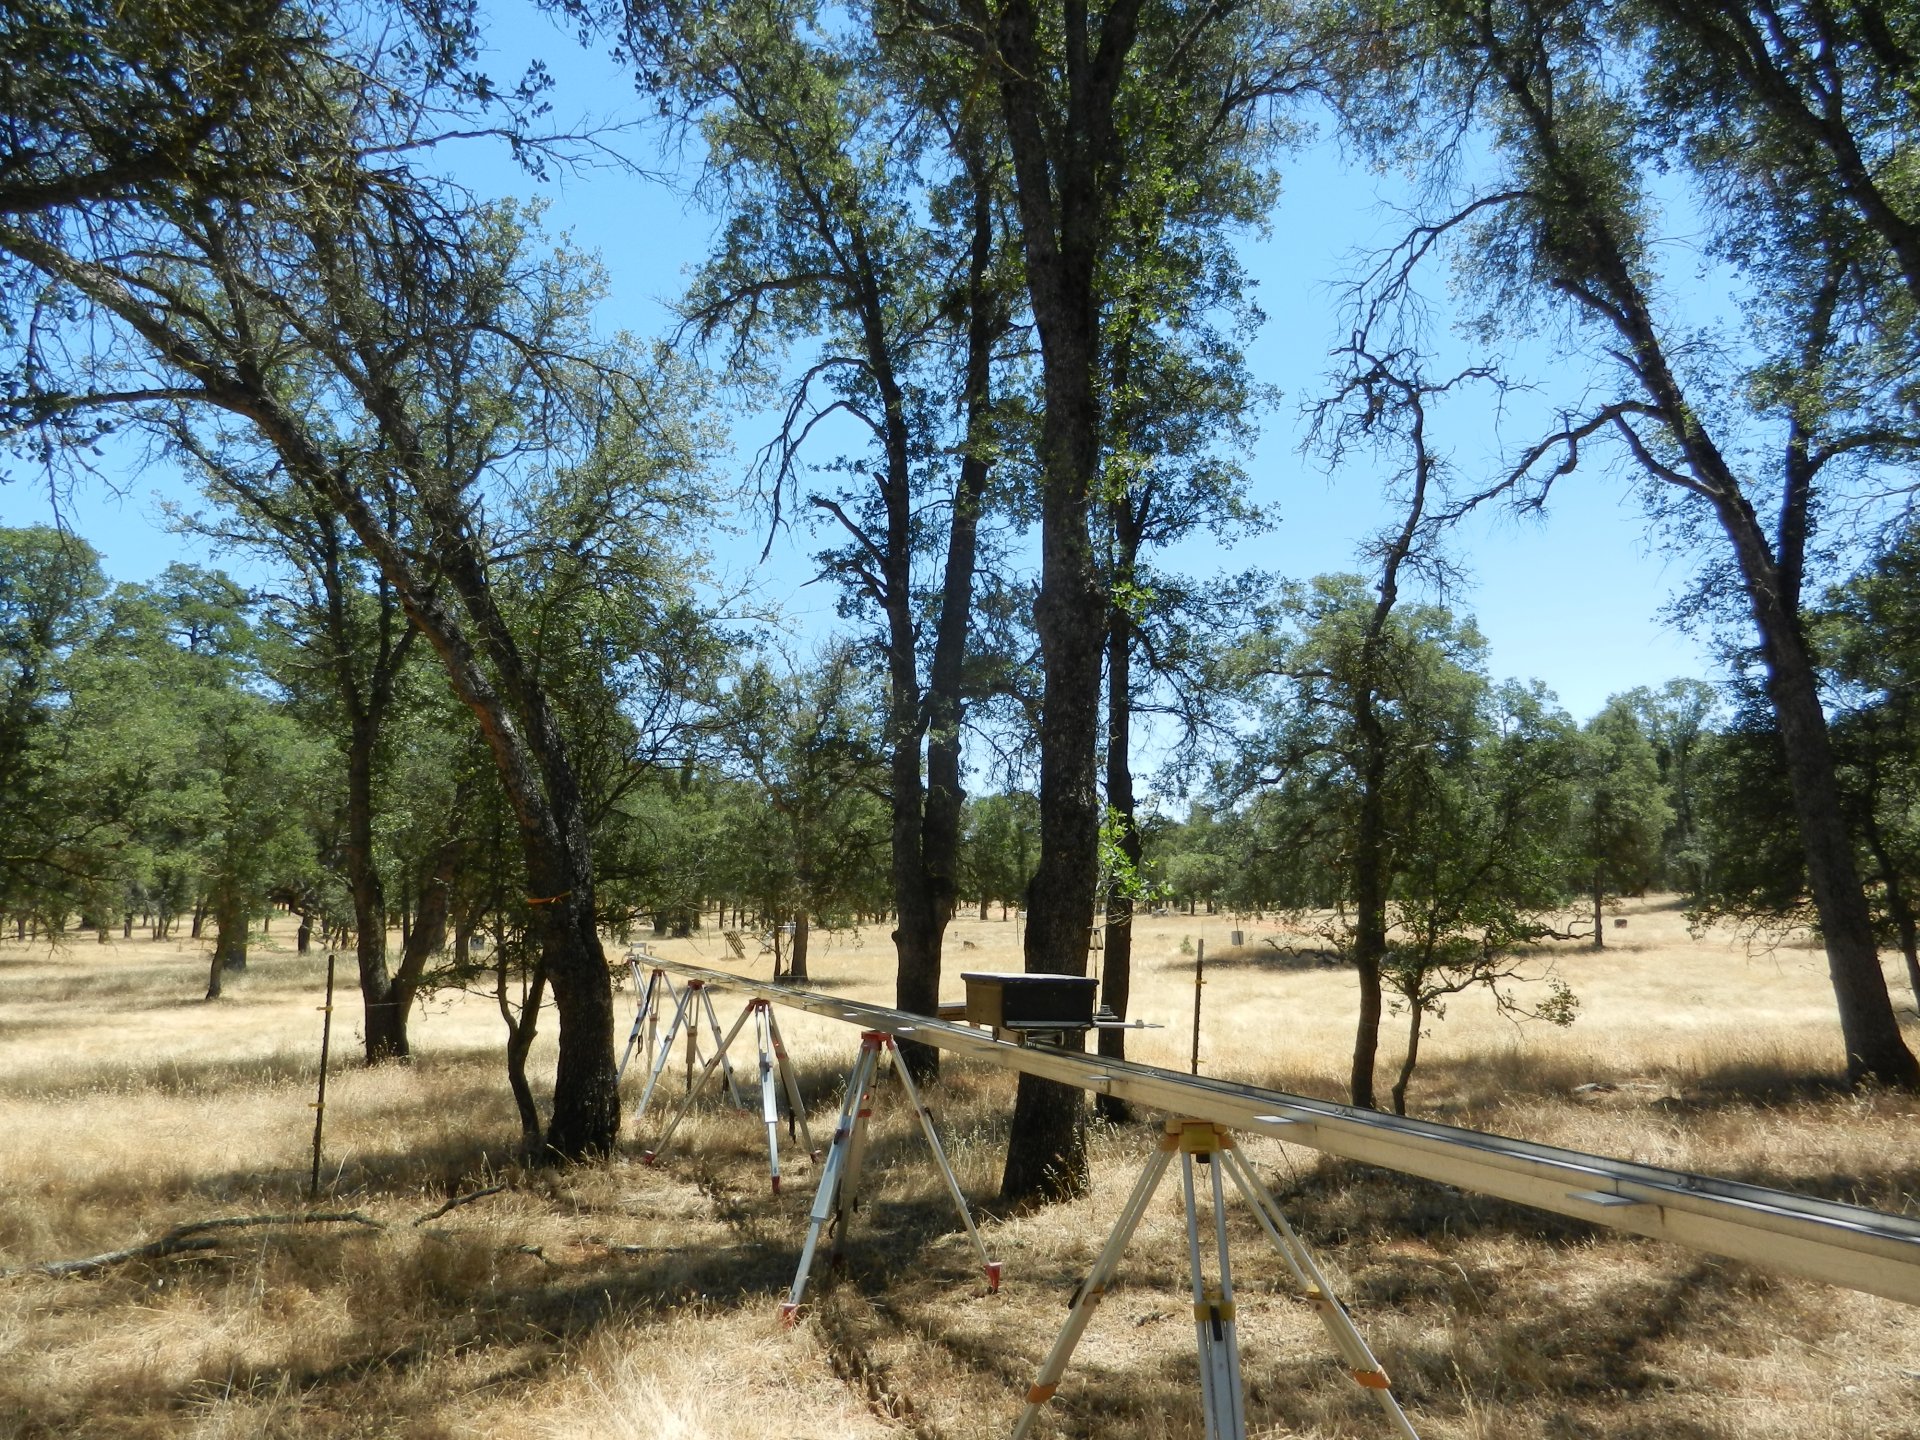
20130619TZ_NewTramLocation3.jpg ( 2013-06-19 13:11:53 ) Full size: 1920x1440
New location for radiometer tram track in the oak woodland
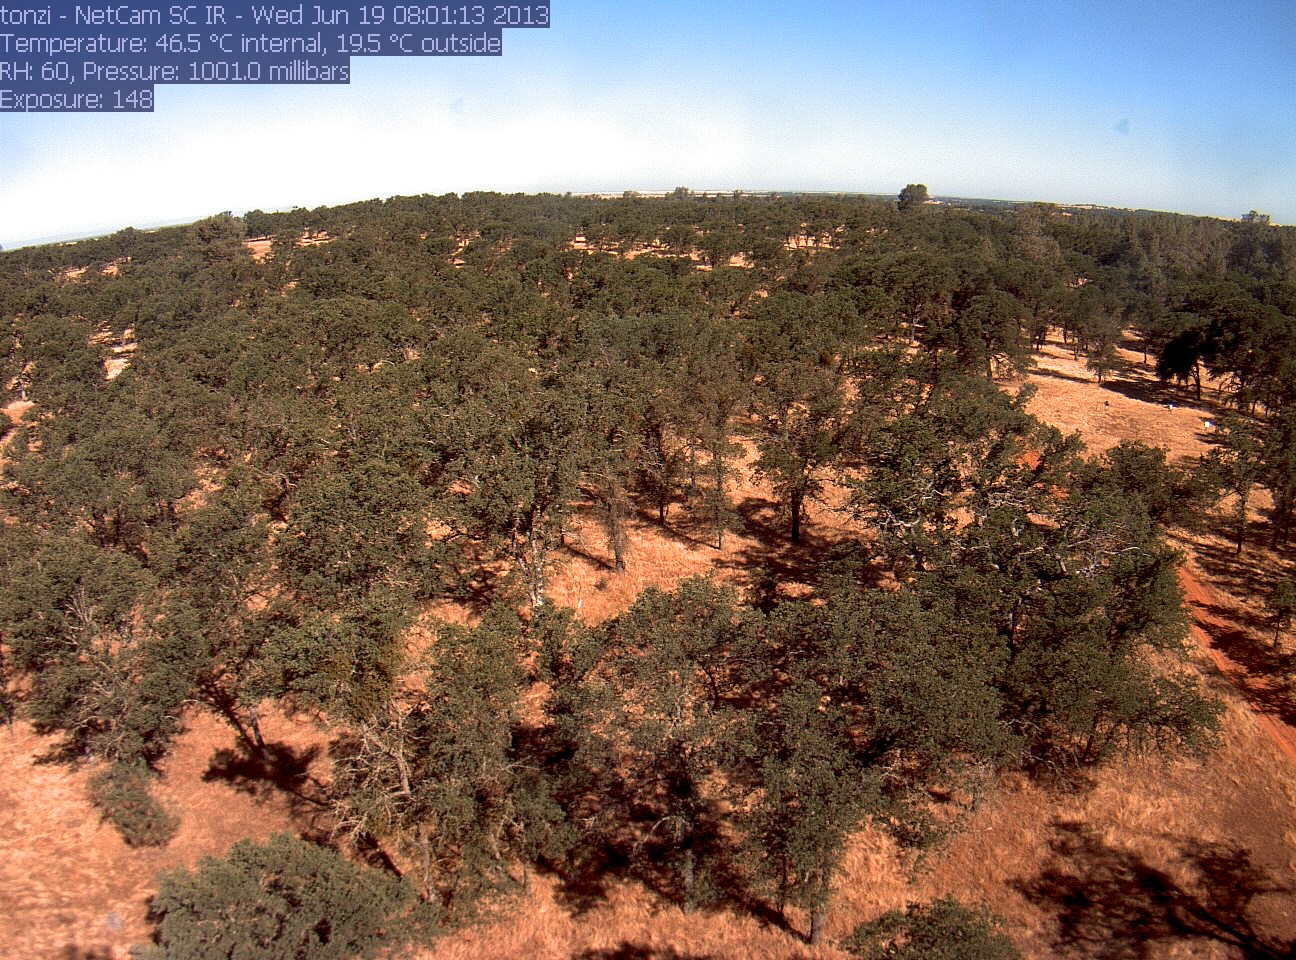
tonzi_2013_06_19_080110.jpg ( 2013-06-19 08:00:52 ) Full size: 1296x960
Just cause
16 sets found
No data found for TZ_Fenergy.
11 TZ_tmet graphs found
11 TZ_soilco2 graphs found
Can't check TZ_mixed
3 TZ_mixed graphs found
1 TZ_fflux graphs found
8 TZ_fmet graphs found
1 TZ_tram graphs found
3 TZ_co2prof graphs found
No data found for TZ_irt.
No data found for TZ_windprof.
1 TZ_tflux graphs found
2 TZ_sm graphs found
Can't check TZ_met
1 TZ_met graphs found
Can't check TZVR_mixed
8 TZ_osu graphs found
No data found for TZ_fd.
Tonzi Z-cam data