
Field Notes
<--2013-06-19 09:30:00 | 2013-07-11 10:30:00-->Other sites visited today: Vaira | Tonzi
Phenocam link: Searching...
Tonzi: 2013-07-11 09:10:00 (DOY 192)
Author: Siyan Ma
Others: Joe
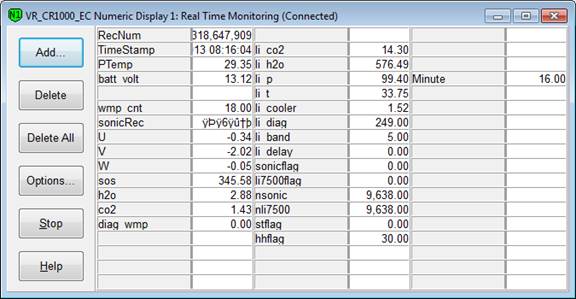
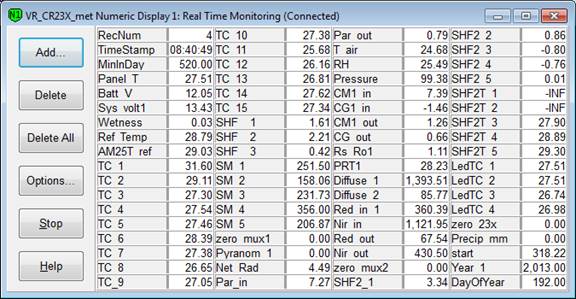
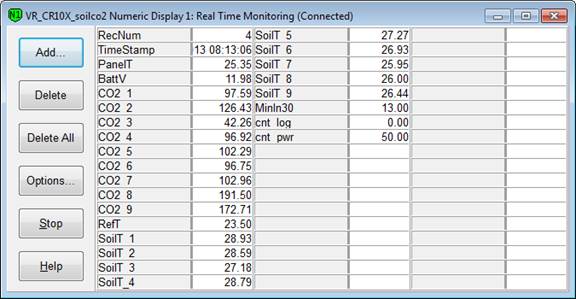
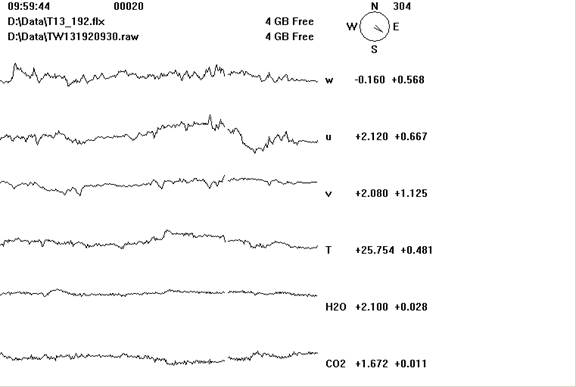
Summary: Standard fieldwork, midday water potential, CO2 profile pump down, HMP45 fan down at VR, Floor CR100 data not recorded - winflux okay
|
When: Date: 7/11/2013, Day: 192 ,
Watch Time: 9:10 am.
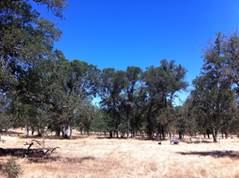
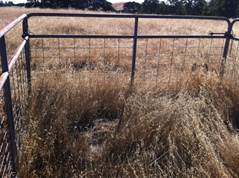
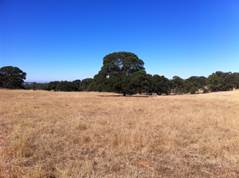
Where: Tonzi/Vaira Ranch Who: Siyan, Joe Weather: clear, sunny, nice breeze, getting drier Phenology: yellow grasses; Joe noticed that some oak trees start to have yellow leaves; a few of small trees along the road in Tonzi Ranch to the tower; they are located on the area with lots of rocks.
Summary
Vaira_Grass Site
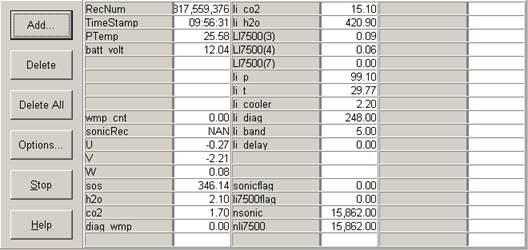
   Tonzi_Tower Site
Toniz_Floor Site
CR23X3 – floor-Met CR23X6 – tower-Met CR10X2 – floor-Met Soil CO2 profile: CR23X5 – soil CO2 profile 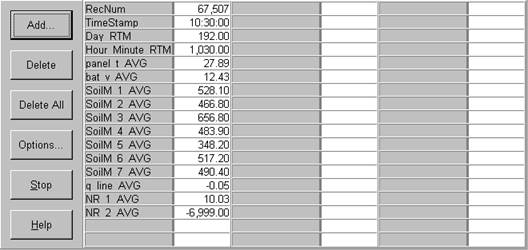 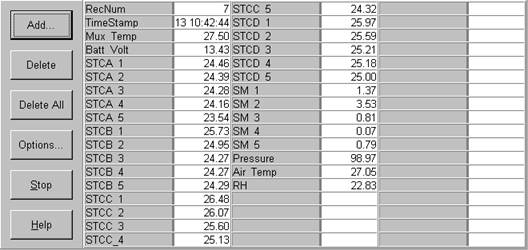 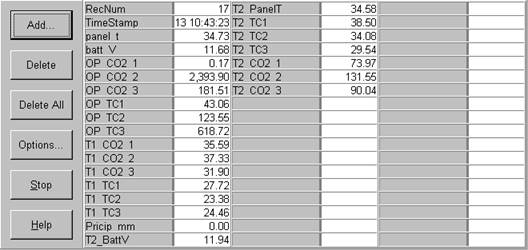 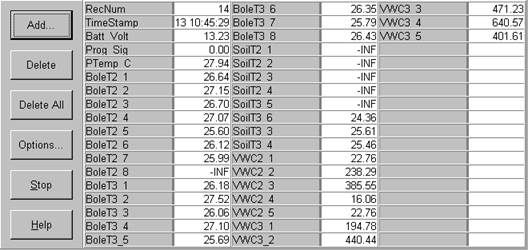
(notes: somehow I forgot to visit Tree 4, 7, and 8 this time.) Midday water potential
| |||||||||||||||||||||||||||||||||||||||||||||||||||||||||||||||||||||||||||||||||||||||||||||||||||||||||||
Field Data
No tank data
Well Depth
| Date | Location | Depth (feet) |
|---|---|---|
| 2013-07-11 | TZ_floor | 29 |
| 2013-07-11 | TZ_road | 38.5 |
| 2013-07-11 | TZ_tower | 33.7 |
No TZ Moisture Point data found
No VR Moisture Point data found
No TZ grass heigth found
No VR grass heigth found
Tree DBH
| Date | Tag# | Reading (mm) |
|---|---|---|
| 2013-07-11 | 1 | 25.1 |
| 2013-07-11 | 102 | 20 |
| 2013-07-11 | 2 | 18.1 |
| 2013-07-11 | 245 | 13.4 |
| 2013-07-11 | 3 | 20 |
| 2013-07-11 | 5 | 24.6 |
| 2013-07-11 | 72 | 15.2 |
| 2013-07-11 | 79 | 17 |
Water Potential - mode: raw
| Time | Species | Tree | readings (bar) | |||||
|---|---|---|---|---|---|---|---|---|
| 2013-07-11 12:00:00 | OAK | 102 | -46 | -37.5 | -29 | |||
| 2013-07-11 12:00:00 | OAK | 35 | -37.5 | -30 | -37 | |||
| 2013-07-11 12:00:00 | OAK | 92 | -30 | -32 | -34 | |||
| 2013-07-11 12:00:00 | PINE | OLD | -6 | -21 | -4.5 | -20 | -14 | |
| 2013-07-11 12:00:00 | PINE | YNG | -3 | -1 | -5 | -8.5 | -3 | -5 |
No TZ Grass Biomass data found
No TZ OakLeaves Biomass data found
No TZ PineNeedles Biomass data found
1 photos found
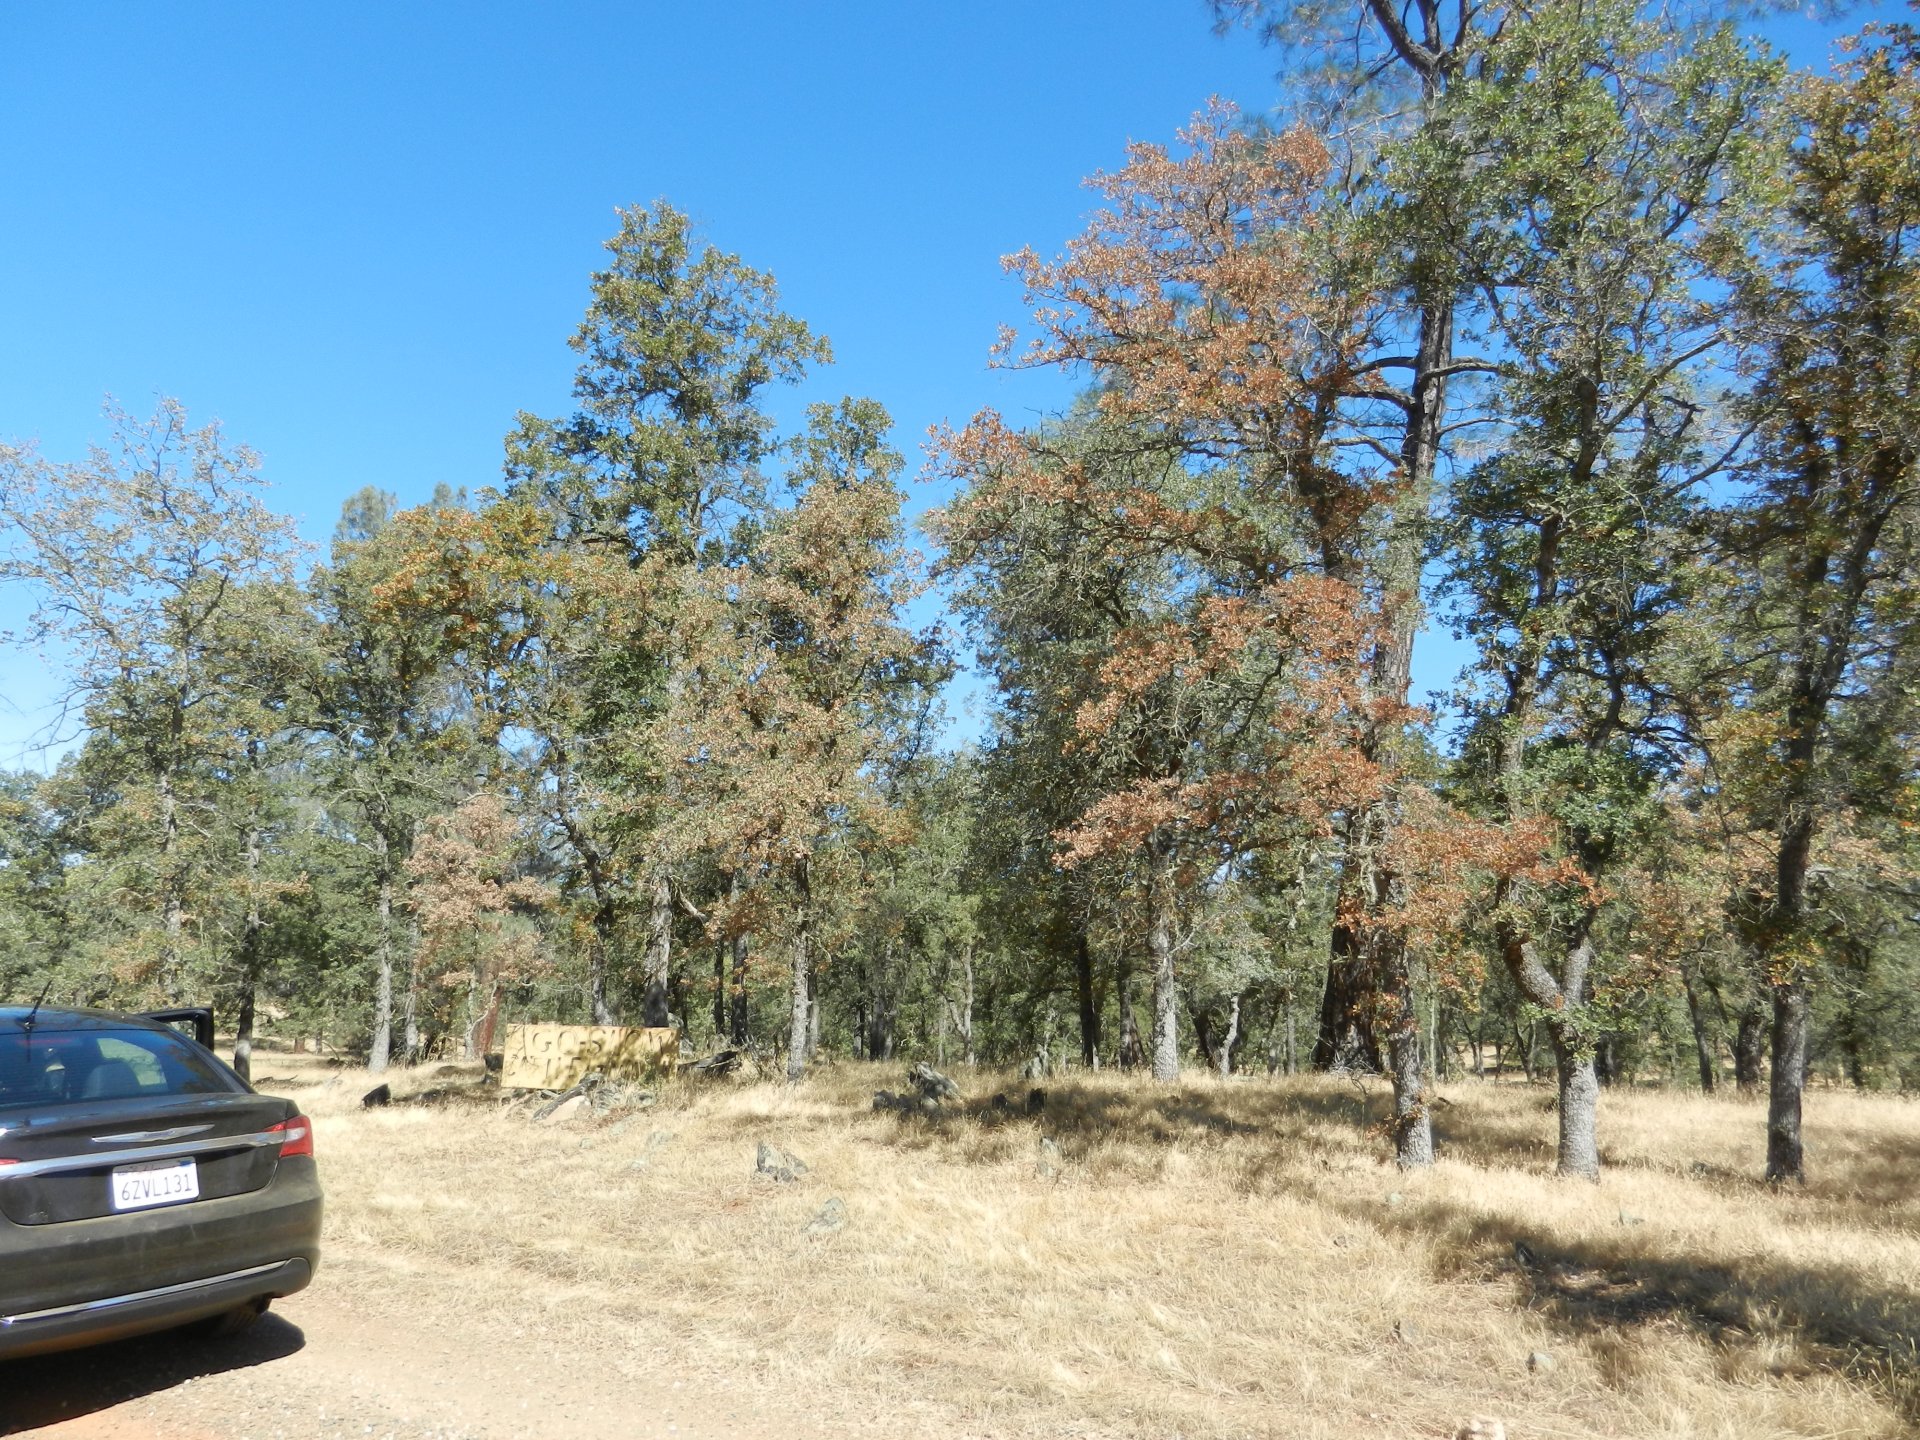
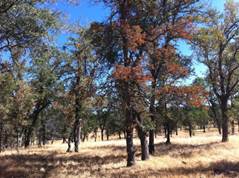
20130711TZ_DeadTrees.jpg ( 2013-07-11 10:17:27 ) Full size: 1920x1440
Dead and dying trees
16 sets found
No data found for TZ_Fenergy.
11 TZ_tmet graphs found
11 TZ_soilco2 graphs found
Can't check TZ_mixed
3 TZ_mixed graphs found
1 TZ_fflux graphs found
8 TZ_fmet graphs found
1 TZ_tram graphs found
3 TZ_co2prof graphs found
No data found for TZ_irt.
No data found for TZ_windprof.
1 TZ_tflux graphs found
2 TZ_sm graphs found
Can't check TZ_met
1 TZ_met graphs found
Can't check TZVR_mixed
8 TZ_osu graphs found
No data found for TZ_fd.
Tonzi Z-cam data