
Field Notes
<--2012-09-19 05:30:00 | 2012-10-09 06:00:00-->Other sites visited today: Tonzi | Vaira
Phenocam link: Searching...
Tonzi: 2012-10-09 05:50:00 (DOY 283)
Author: Siyan Ma
Others: Joe
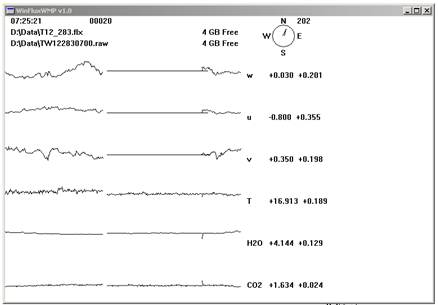
Summary: Pre-dawn water potential, Oaks 80-90% senescent, standard field work, Joe installed CR1000s at Tonzi, Tram broken, Tower IRGA fouled and cleaned.
|
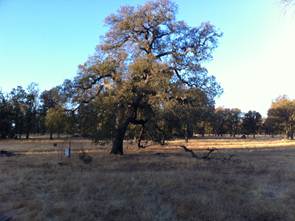
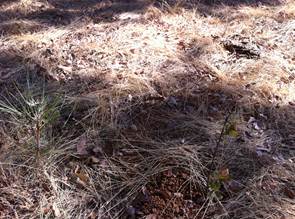
When: Date: 10/09/2012 , Day: 283 , Watch Time: 5:50 am . Where: Tonzi/Vaira Ranch Who: Siyan, Joe Weather: very cold in the early morning; clear, sunny Phenology: golden grass litters; I heard a kind of sounds as if litters were breaking; Oak leaves 80% turned into yellow and brown. It is about the time of leavf-off.
Summary
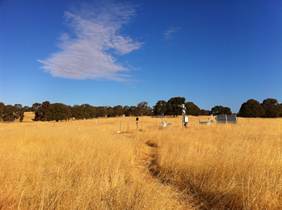
Vaira_Grass Site
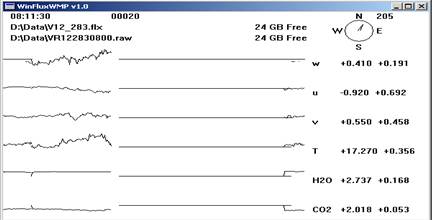
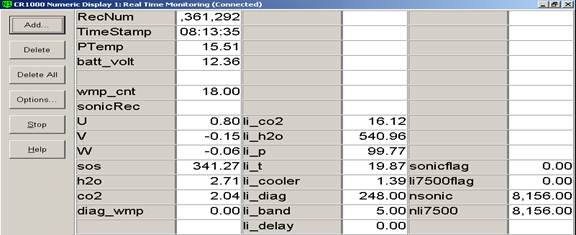
Tonzi_Tower Site
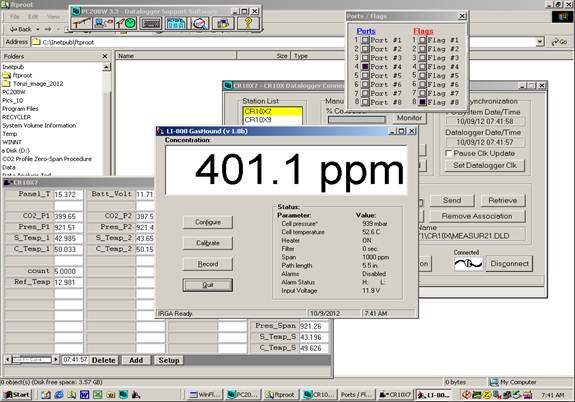
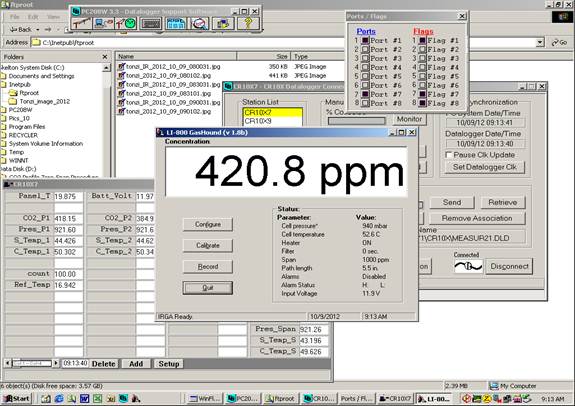
CO2 900 psig; flow 18 psi; 421.63 ppm. N2 1000 psig; flow 20 psi. Is the pump running YES! Readings before calibration: 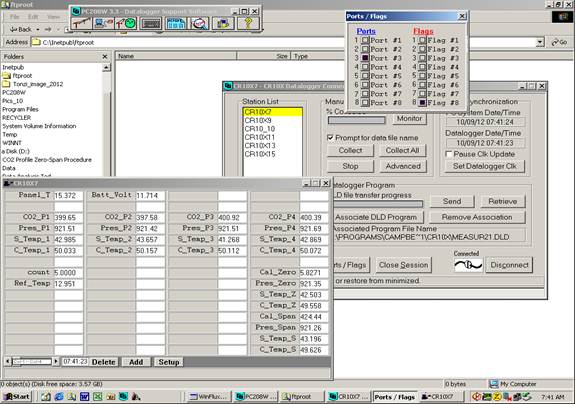
Zero: 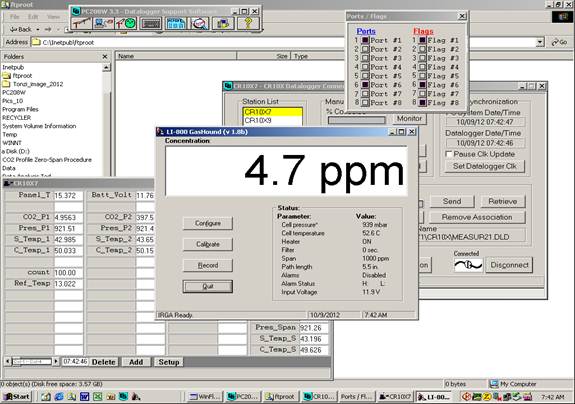

Span: 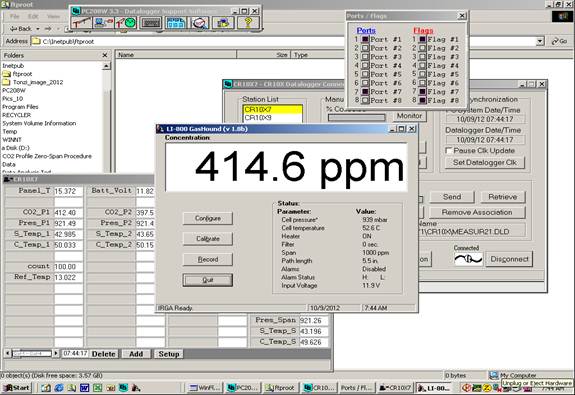
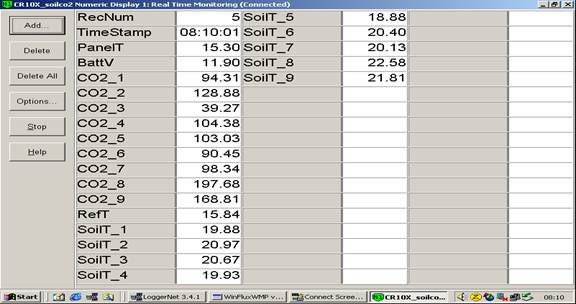
Toniz_Floor Site
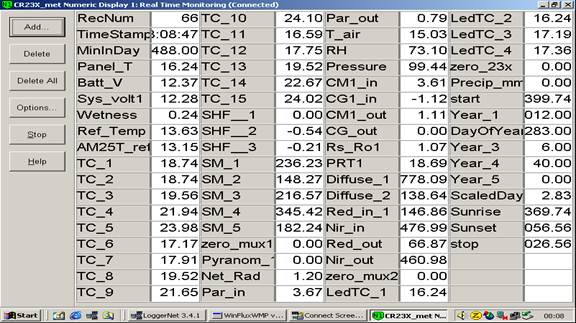
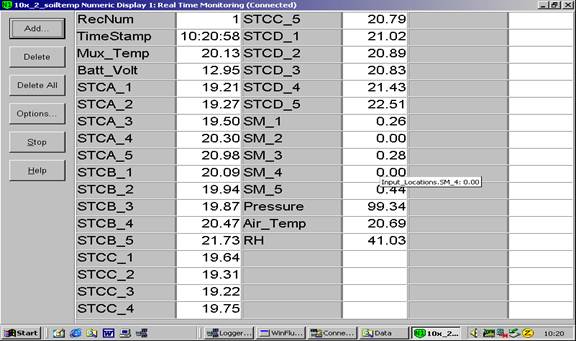
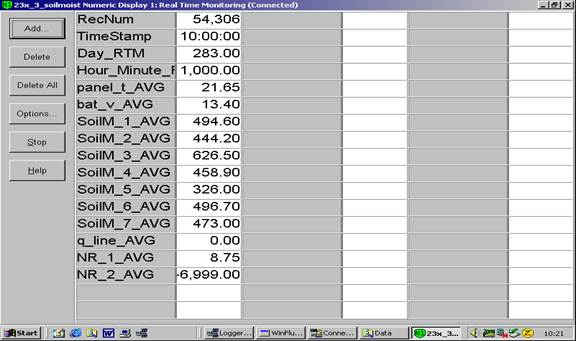
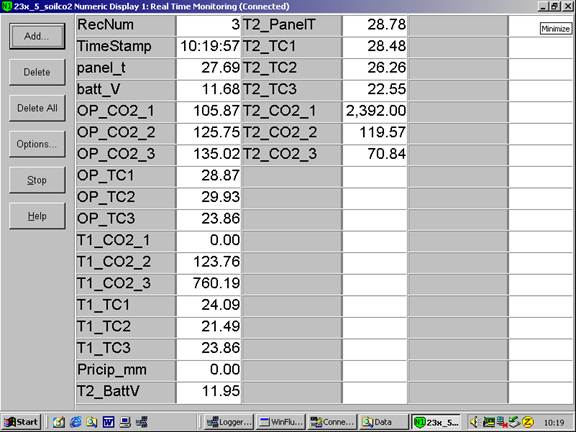
CR23X3 – floor-Met CR23X6 – tower-Met CR10X2 – floor-Met 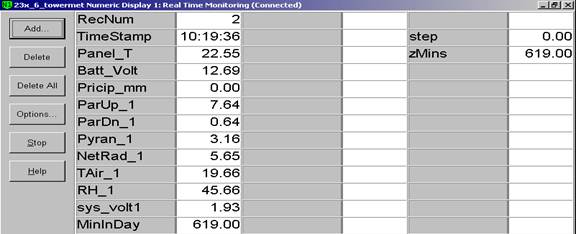
Dendrometers installed by Gretchen group 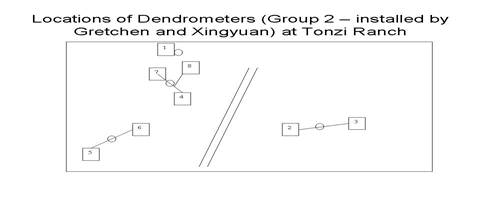
| ||||||||||||||||||||||||||||||||||||||||||||||||||||||||||||||||||||||||||||||||||||||||||||||||||||||||||||||||||||||||||||||||||||||||||||||||||||||||||||||||||||||||||||||||||||||||||||||||||||||||||||||||||||||||||||||||||||||||||||||||||||||||||||||||||||||||||||||||||||||||||||||||||||||||||||||||||||||||||||||||||||||||||||
Field Data
No tank data
Well Depth
| Date | Location | Depth (feet) |
|---|---|---|
| 2012-10-09 | TZ_floor | 29.6 |
| 2012-10-09 | TZ_road | 37.8 |
| 2012-10-09 | TZ_tower | 34.7 |
No TZ Moisture Point data found
No VR Moisture Point data found
No TZ grass heigth found
No VR grass heigth found
Tree DBH
| Date | Tag# | Reading (mm) |
|---|---|---|
| 2012-10-09 | 1 | 21.5 |
| 2012-10-09 | 102 | 14.9 |
| 2012-10-09 | 2 | 14.4 |
| 2012-10-09 | 245 | 10 |
| 2012-10-09 | 3 | 18.1 |
| 2012-10-09 | 4 | 3 |
| 2012-10-09 | 5 | 23.9 |
| 2012-10-09 | 7 | 15.2 |
| 2012-10-09 | 72 | 10.6 |
| 2012-10-09 | 79 | 10.2 |
| 2012-10-09 | 8 | 6.6 |
Water Potential - mode: raw
| Time | Species | Tree | readings (bar) | |||||
|---|---|---|---|---|---|---|---|---|
| 2012-10-09 05:40:00 | OAK | UNKNOWN | -55 | -55 | -40 | -27 | -20 | -25 |
| 2012-10-09 05:40:00 | PINE | UNKNOWN | -15 | -10 | -22 | -22 | -27 | -10 |
| 2012-10-09 10:40:00 | OAK | UNKNOWN | -65 | -45 | -41 | -38 | -42 | -37 |
| 2012-10-09 10:40:00 | PINE | UNKNOWN | -21 | -20 | -12 | -25 | -6 | -10 |
| 2012-10-09 12:40:00 | OAK | UNKNOWN | -52 | -33 | -41 | -33 | -35 | |
| 2012-10-09 12:40:00 | PINE | UNKNOWN | -7 | -7 | -6 | -6.5 | -7 | -22 |
No TZ Grass Biomass data found
No TZ OakLeaves Biomass data found
No TZ PineNeedles Biomass data found
3 photos found
20121009TZ_FloorCR1000.jpg ( 2012-10-09 08:36:39 ) Full size: 1920x1440
New CR1000 for flux at Tonzi Floor
20121009TZ_Squirrel.jpg ( 2012-10-09 07:25:19 ) Full size: 1920x1440
Grey squirrel
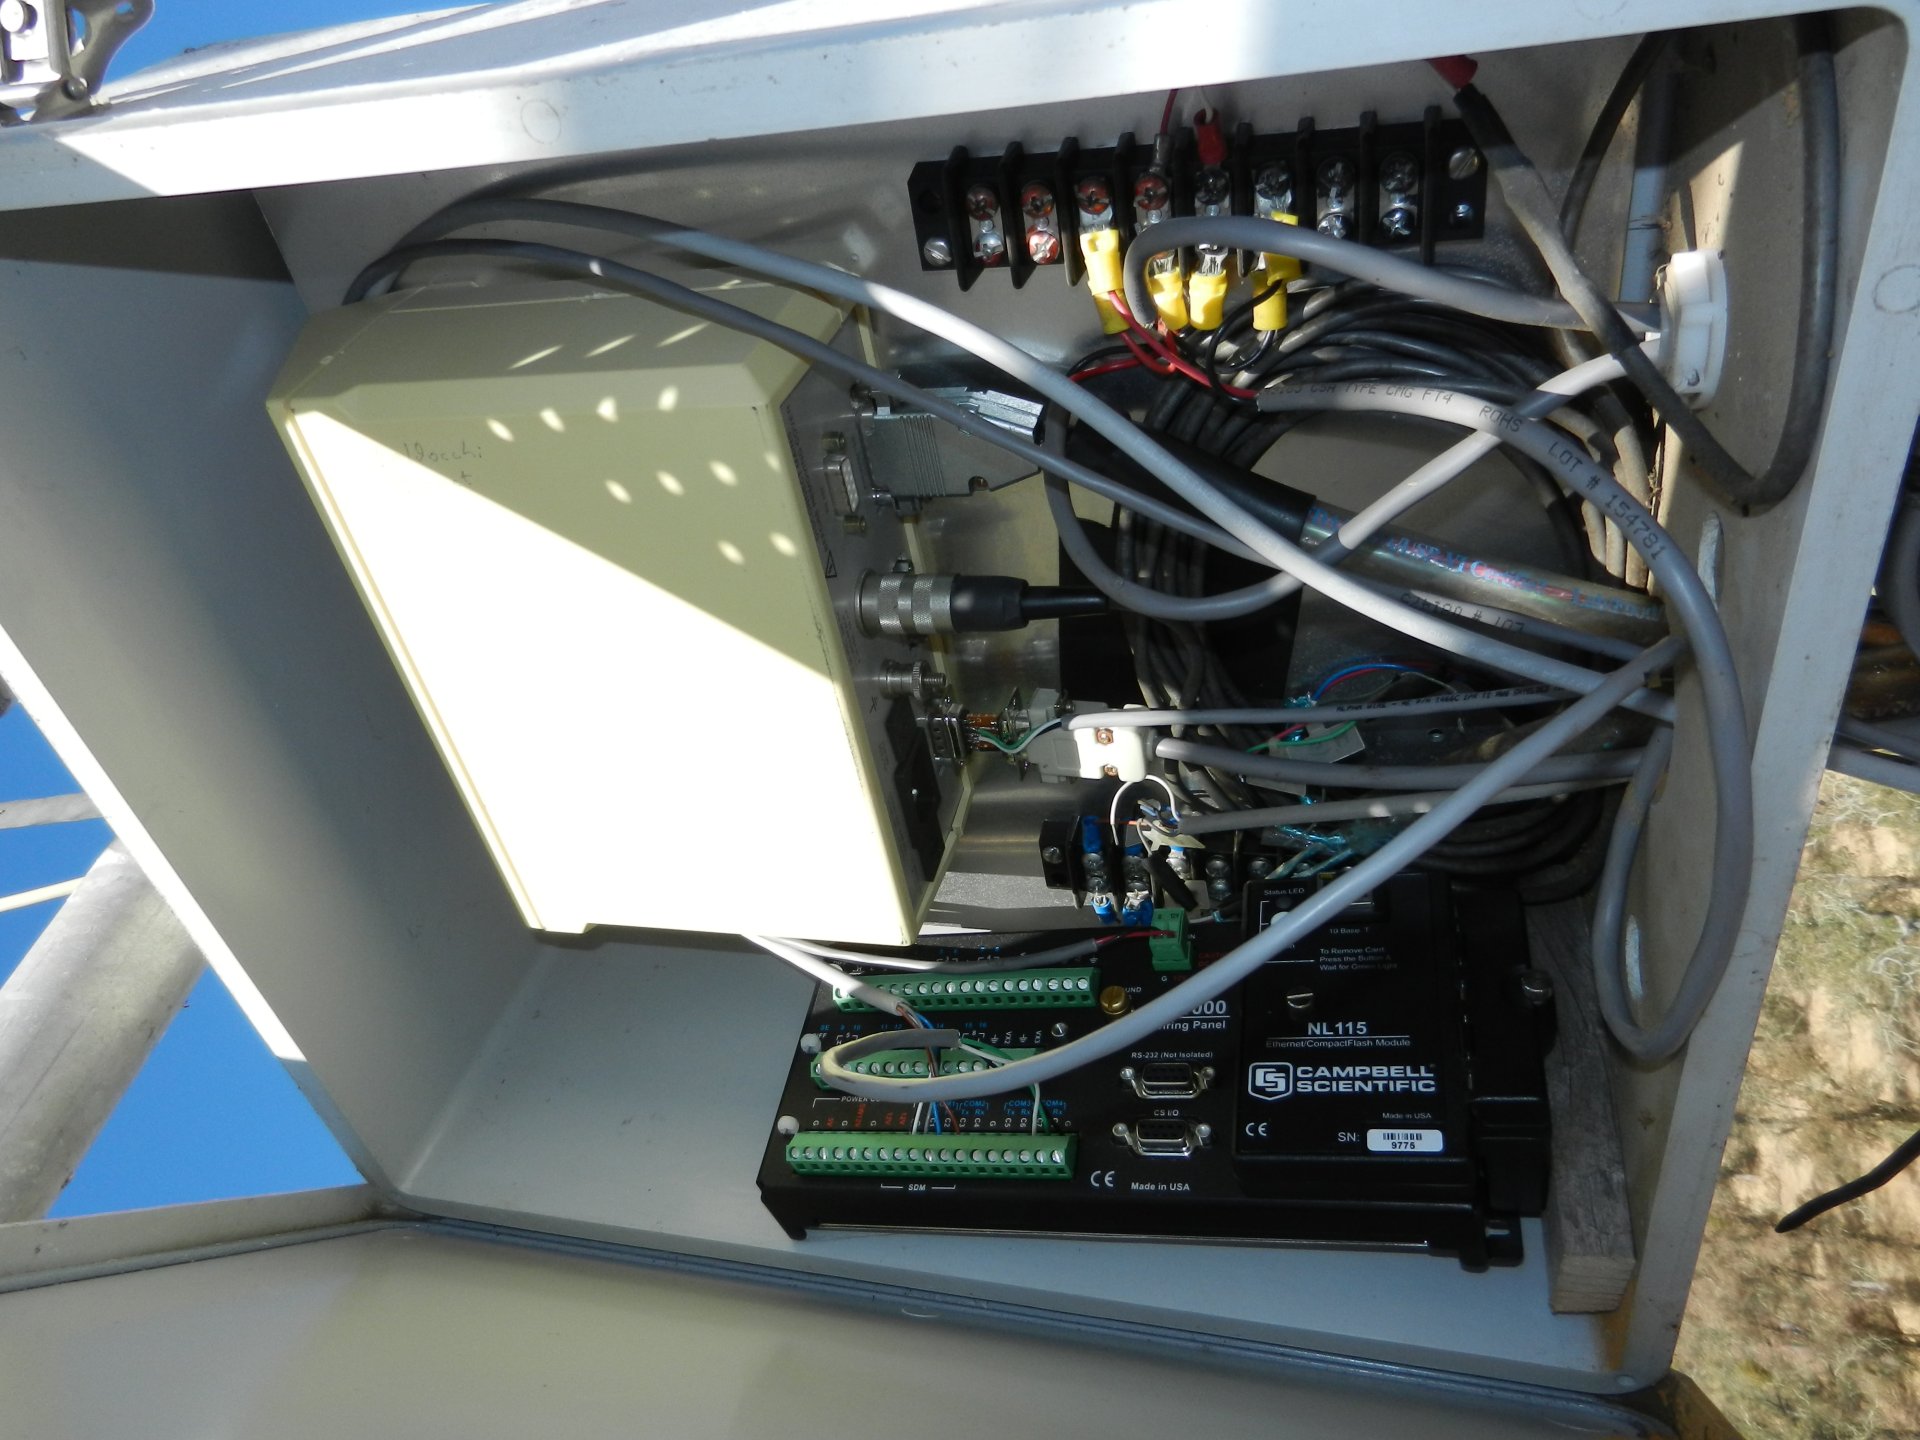
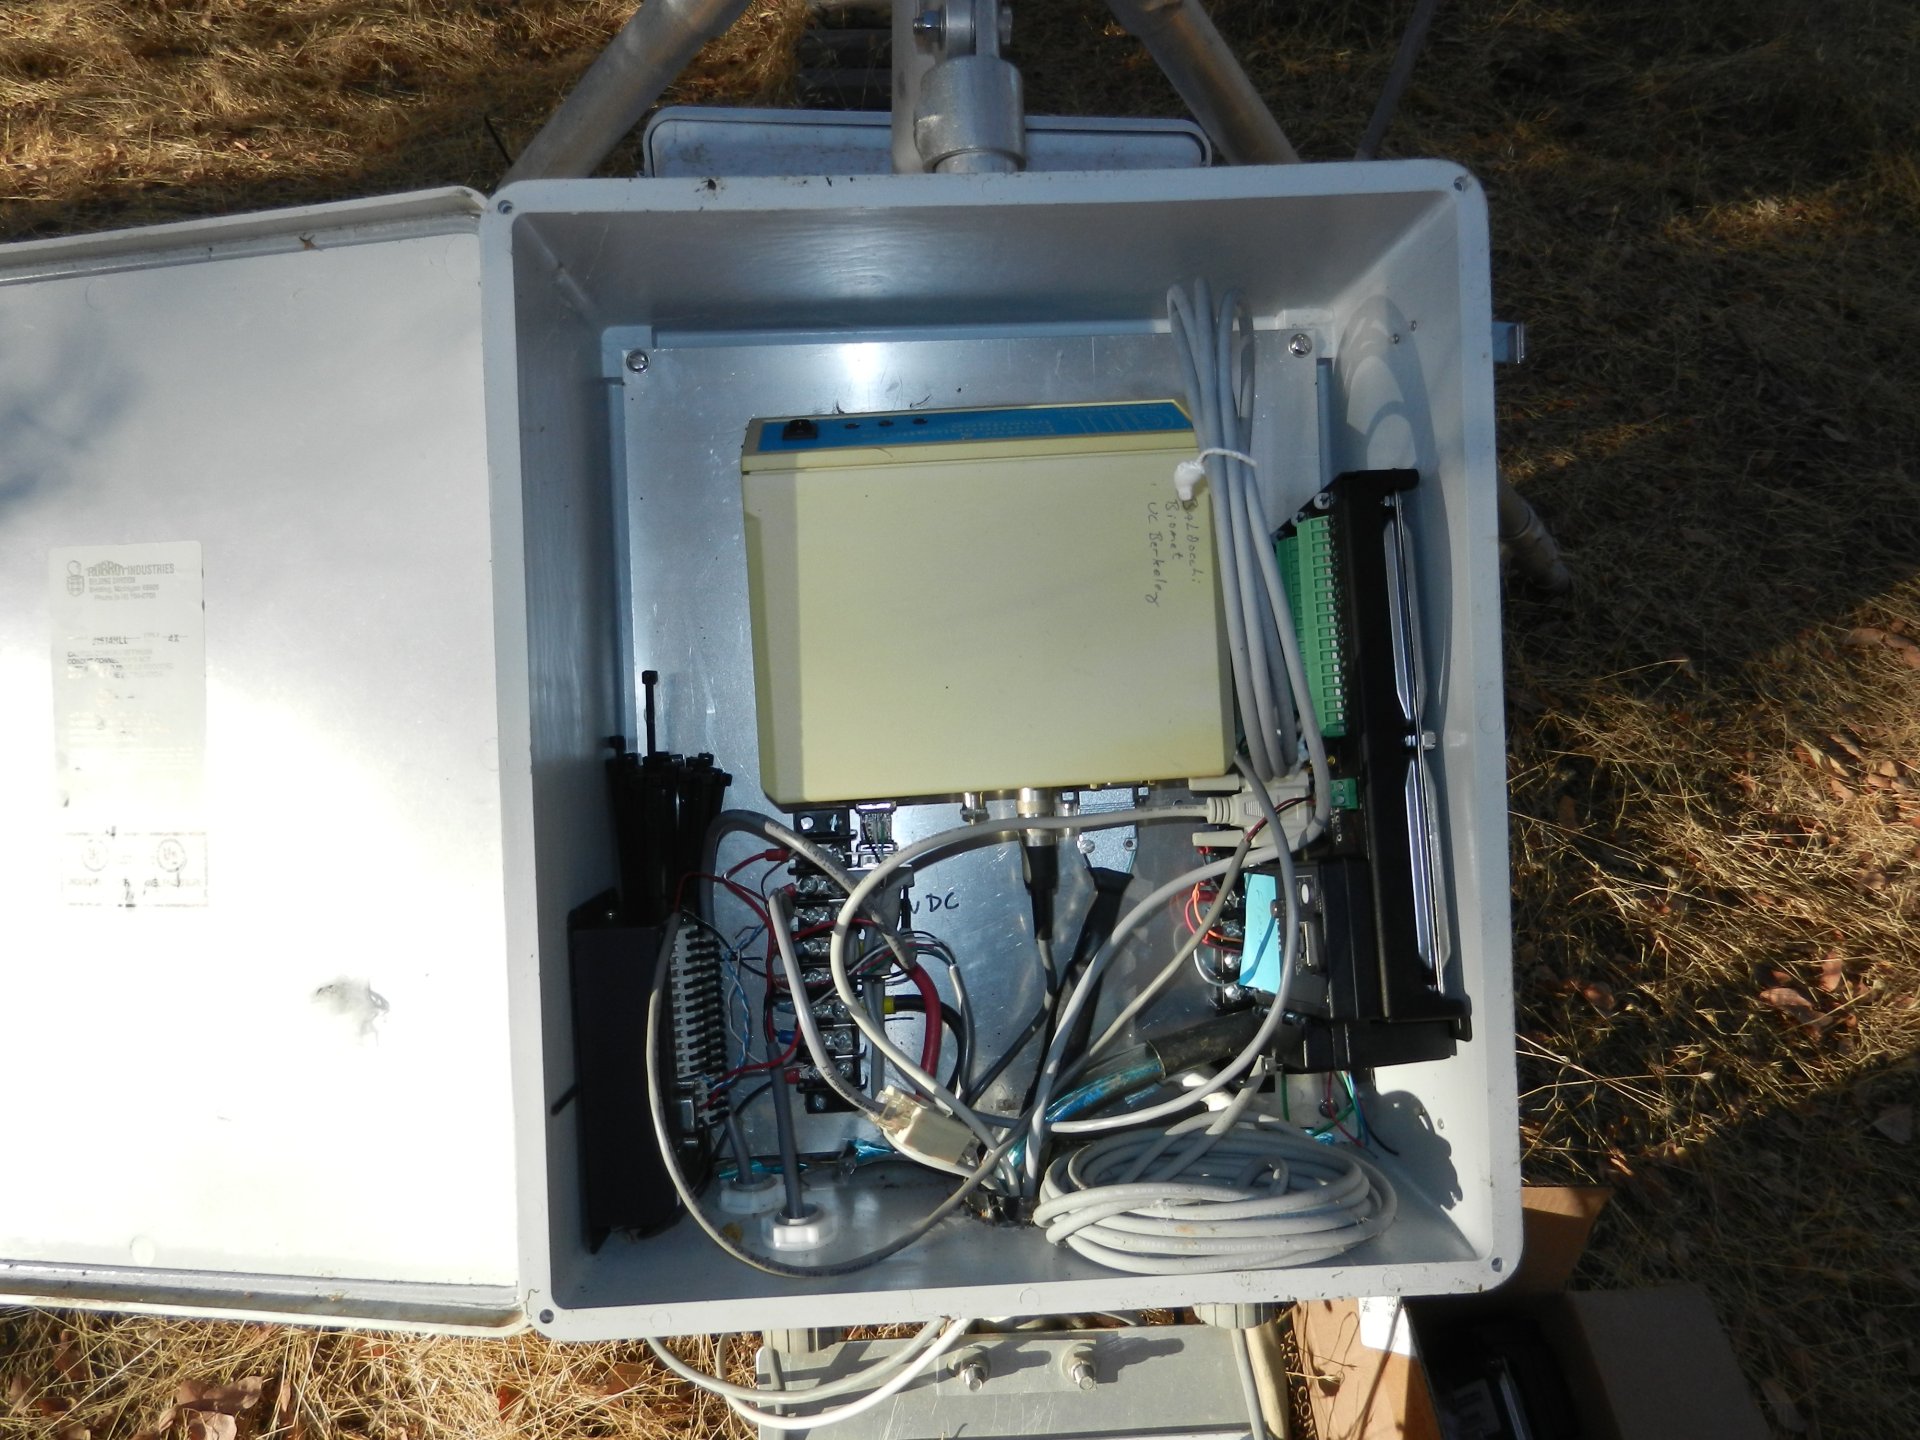
20121009TZ_TowerCR1000.jpg ( 2012-10-09 11:39:11 ) Full size: 1920x1440
New CR1000 for flux at the top of Tonzi Tower.
16 sets found
No data found for TZ_Fenergy.
11 TZ_tmet graphs found
11 TZ_soilco2 graphs found
Can't check TZ_mixed
3 TZ_mixed graphs found
1 TZ_fflux graphs found
8 TZ_fmet graphs found
1 TZ_tram graphs found
3 TZ_co2prof graphs found
No data found for TZ_irt.
No data found for TZ_windprof.
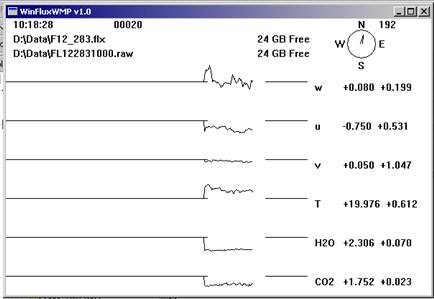
1 TZ_tflux graphs found
2 TZ_sm graphs found
Can't check TZ_met
1 TZ_met graphs found
Can't check TZVR_mixed
8 TZ_osu graphs found
No data found for TZ_fd.
Tonzi Z-cam data