
Field Notes
<--2012-09-19 05:15:00 | 2012-10-09 05:50:00-->Other sites visited today: Tonzi | Vaira
Phenocam link: Searching...
Tonzi: 2012-09-19 05:30:00 (DOY 263)
Author: Siyan Ma
Others: Joe
Summary: Standard field work, reinstalled CO2 profile IRGA, fixed daily rename at Vaira.
|
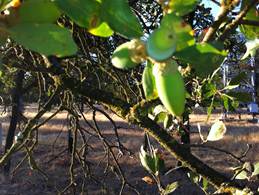
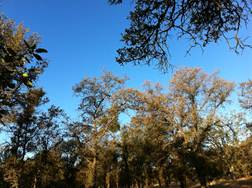
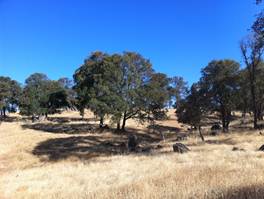
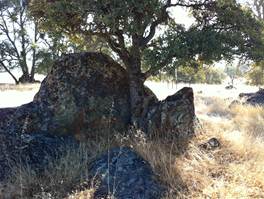
When: Date: 9/19/2012 , Day: 263 , Watch Time: 5:30 am . Where: Tonzi/Vaira Ranch Who: Siyan, Joe Weather: clear, sunny Phenology: oak trees did not look that brown, but some had a lot of brown leaves, almost entire canopy.
Summary
Vaira_Grass Site
(sorry, forgot downloading the images of screen shots.)
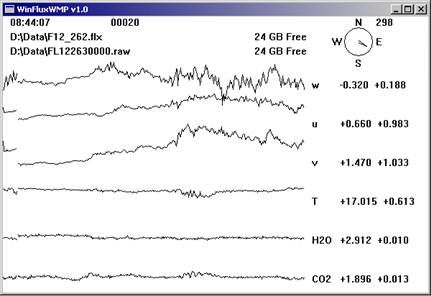
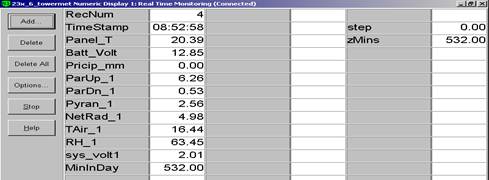
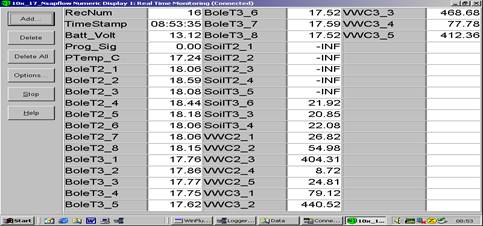
Tonzi_Tower Site
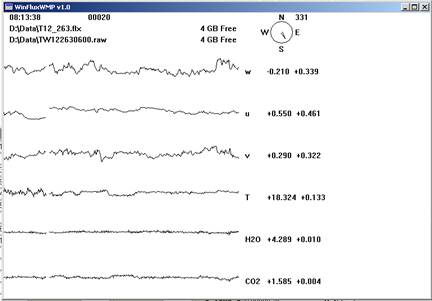
CO2 900 psig; flow 20 psi; 421.63 ppm. N2 1100 psig; flow 20 psi. Is the pump running Joe installed IRGA back. Readings before calibration: 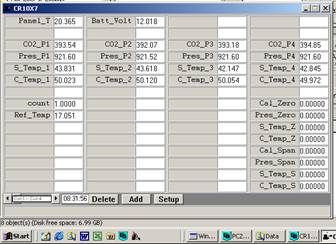
Before zero: 
After Zero: 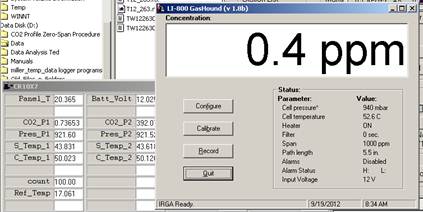
Before Span: 
After Span: 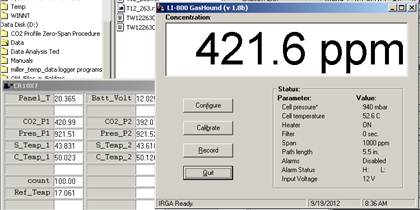
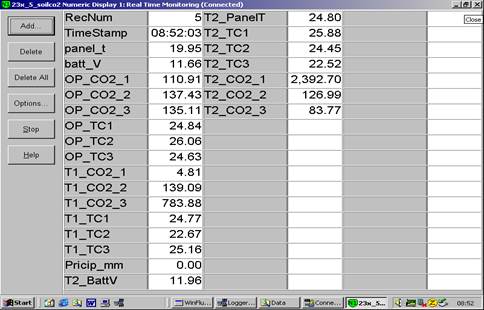
Toniz_Floor Site
CR23X3 – floor-Met CR23X6 – tower-Met CR10X2 – floor-Met 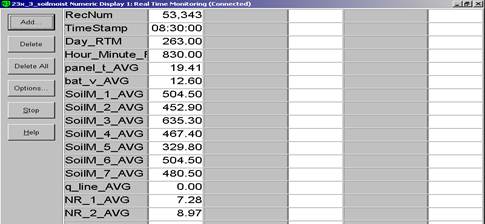
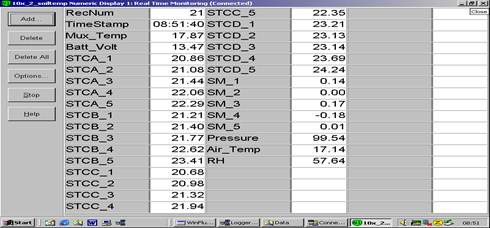
Notes: “X” means not working any more. Dendrometers installed by Gretchen group 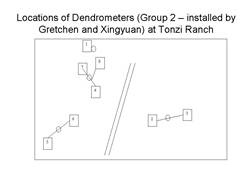
| |||||||||||||||||||||||||||||||||||||||||||||||||||||||||||||||||||||||||||||||||||||||||||||||||||||||||||||||||||||||||||||||||||||||||||||||||||||||||||||||||||||||||||||||||||||||||||||||||||||||||||||||||||||||||||||||||||||||||||||||||||||||||||||||||||||||||||||||||||||||||||||||||||||||||||||||||||||||||||||
Field Data
No tank data
Well Depth
| Date | Location | Depth (feet) |
|---|---|---|
| 2012-09-19 | TZ_floor | 28.6 |
| 2012-09-19 | TZ_road | 35 |
| 2012-09-19 | TZ_tower | 34 |
No TZ Moisture Point data found
No VR Moisture Point data found
No TZ grass heigth found
No VR grass heigth found
Tree DBH
| Date | Tag# | Reading (mm) |
|---|---|---|
| 2012-09-19 | 1 | 21.6 |
| 2012-09-19 | 102 | 13.9 |
| 2012-09-19 | 2 | 14.5 |
| 2012-09-19 | 245 | 10.1 |
| 2012-09-19 | 3 | 18.1 |
| 2012-09-19 | 4 | 3.1 |
| 2012-09-19 | 5 | 24 |
| 2012-09-19 | 7 | 19.1 |
| 2012-09-19 | 72 | 10.8 |
| 2012-09-19 | 79 | 10.3 |
| 2012-09-19 | 8 | 6.9 |
Water Potential - mode: raw
| Time | Species | Tree | readings (bar) | ||||||||
|---|---|---|---|---|---|---|---|---|---|---|---|
| 2012-09-19 05:20:00 | OAK | UNKNOWN | -49 | -51.5 | -44 | -53 | -55 | -55 | -27.5 | -28 | -26.5 |
| 2012-09-19 05:20:00 | PINE | UNKNOWN | -25 | -15 | -20 | -25 | -25 | -13 | |||
| 2012-09-19 10:14:00 | OAK | UNKNOWN | -55.5 | -42 | -48 | -38 | -40 | -49 | -37 | -37 | |
| 2012-09-19 10:14:00 | PINE | UNKNOWN | -17 | -12 | -15 | -22 | -21 | ||||
No TZ Grass Biomass data found
No TZ OakLeaves Biomass data found
No TZ PineNeedles Biomass data found
1 photos found
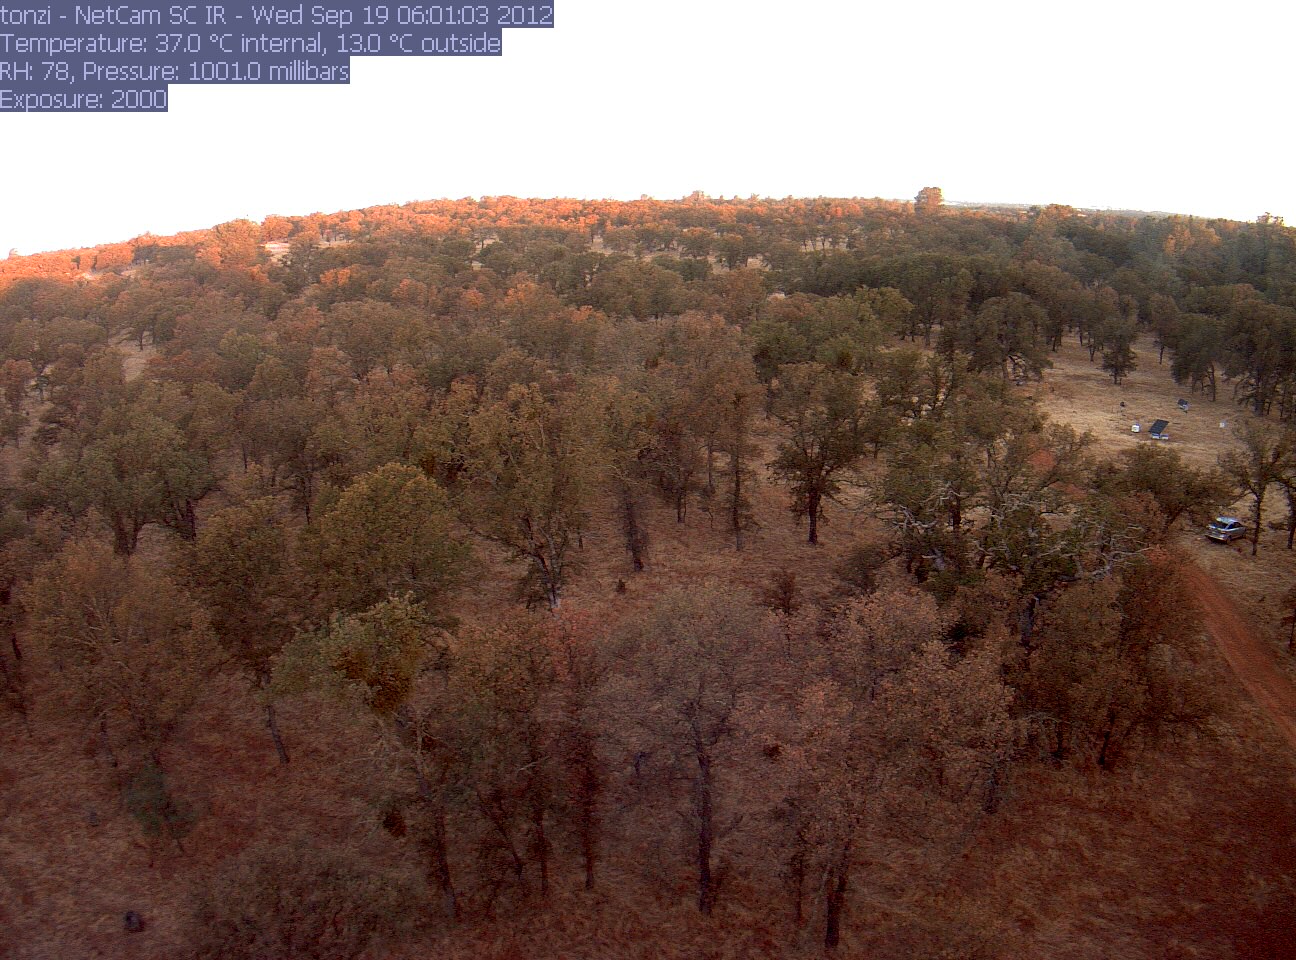
tonzi_2012_09_19_060103.jpg ( 2012-09-19 05:58:02 ) Full size: 1296x960
Predawn water potential
16 sets found
No data found for TZ_Fenergy.
11 TZ_tmet graphs found
11 TZ_soilco2 graphs found
Can't check TZ_mixed
3 TZ_mixed graphs found
1 TZ_fflux graphs found
8 TZ_fmet graphs found
1 TZ_tram graphs found
3 TZ_co2prof graphs found
No data found for TZ_irt.
No data found for TZ_windprof.
1 TZ_tflux graphs found
2 TZ_sm graphs found
Can't check TZ_met
1 TZ_met graphs found
Can't check TZVR_mixed
8 TZ_osu graphs found
No data found for TZ_fd.
Tonzi Z-cam data