Field Notes
<--2012-10-09 05:50:00 | 2012-10-24 11:30:00-->Other sites visited today: Tonzi | Vaira
Phenocam link: Searching...
Tonzi: 2012-10-09 06:00:00 (DOY 283)
Author: Joe Verfaillie
Others: Siyan
Summary: Tram broken, Installed CR1000s, serviced z-cams, cleaned radiation sensors, tower 7500 had weird values seemingly fixed by cleaning, water potential, fence batteries dead.
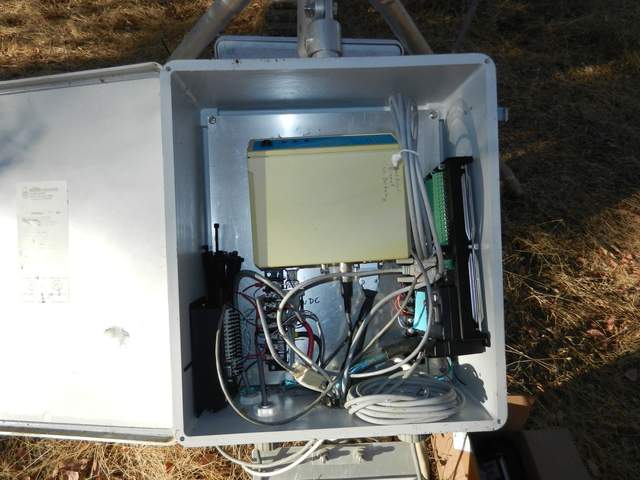
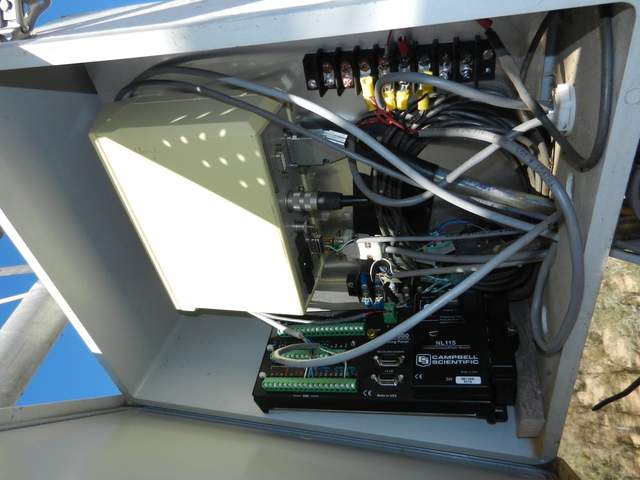
| Tonzi 2012-10-09 I arrived about 6am PDT with Siyan. It was dark and cool with about a quarter moon. The day was clear, sunny and mild. At first there was little to no wind, then a breeze from the east swinging around to the south after noon. All trees have significant brown leaves. There is still some water in Tonzi�s pond, so despite the surface being very dry, there is water at depth. I napped while Siyan did water potential. When it got light enough I noticed that the tram had stopped. It had derailed and timed out. I reset in and it started to run again, but I noticed that one of the motors seemed slower than the other and it was taking about 10 minutes longer to complete a lap. Later in the day I tried disconnecting the slower motor and driving it with just one motor. It looked okay at first but later got stuck again. I brought it in for maintenance. I installed a CR1000 (sn 50615) and CF interface (sn 9774) at the floor site. It went in the box with the Gill PSU and the CR200 that controls the z-cam. This is a temporary location. I cut out some large spools of extra cable on the Gill and LI7500 power cables. The serial splitter plugged into the Gill PSU and the SDM cable plugged into the LI7500. The floor computer crashed when I tried to add a USB to serial adapter for the CR1000. While the computer was down I swapped its internal fan that has not been working. After restarting, I was able to add the CR1000 to the Loggernet list and get it connected. All data is being collected on the 2GB flash card so the Loggernet connection is only needed to check the CR1000. I forgot to check the time on the CR1000! We went to Vaira about 9am and returned to Tonzi about 10am. I installed another CR1000 (sn 50616) and CF interface (sn 9775) at the top of the tower. It went into the box with the Gill PSU one level below the top. One will have to climb to the top of the tower to swap data cards, but one should be up there to check on the other sensors anyway. I have not run a serial line down to the computer yet, but plan to do so. The serial splitter plugged into the PSU and the SDM cable plugged into the LI7500. I forgot to check the time on the CR1000! I serviced the z-cams. The windows on numbers 1 and 2 near the tower were clean. I cleaned the window on z-cam 3 near the floor site. The batteries on the fence chargers around the tower and soil co2 site are dead � no power before sunrise. These will need to be swapped out and the fences need maintenance once the ground soften ups. I tested the HMP45 at the tower top with the Vaisala lab standard. The lab standard gave readings between the before and after readings from the HMP45: Temp before = 18.2, Lab standard = 18.8, after 19.8 RH before = 52.7, Lab standard = 47.0, after 46.1 The method of pulling out the HMP45 and inserting the Lab standard in the solar shield seemed difficult to me. It took a long time for the lab standard to settle and then a long time for the HMP45 to settle after being reinserted. It might be better to rig up a shield for the lab standard to be mounted next to the field instruments. In doing this comparison I stopped the ventilation fan and it got stuck on grim on the inside of its housing. I was able to scrape out the grime and it began to run again. I also cleaned the Teflon fitting on the HMP45 wiping it off on my shirt. I cleaned the radiation sensors. The insulation on the cables of these sensors is cracking with age and sun exposure. Maybe we should think about swapping all sensors on a rotating basis. The LI7500 was reading a little off. AGC was okay at 61 but there was some bird poop on the upper lens. After cleaning the readings were more reasonable and AGC was a bit better. I looked at the tower computer towards cleaning up its serial connections. Here�s a list of its ports: Com1, CR10X7, CO2 profile, Back plane Com2, CR10X9, Tram, Back plane Com3, winflux, USB back Com4, LI800, USB back Com5, sap flow, USB front, This used to be CR10_10 (surface renewal?) now broken sap flow Com7, sap flow, USB hub, CR10X11 not working Com8, sap flow, USB hub, CR10X13 not working Com9, sap flow, USB hub, CR10X15 not working I also checked on Sonic and IRGA serial numbers: Tower: IRGA sn 0976, sonic sn 000021 (very hard to read) Floor: IRGA sn 0073, sonic sn 000023 (tested on Jun 13, 2005) |
Field Data
No tank data
Well Depth
| Date | Location | Depth (feet) |
|---|---|---|
| 2012-10-09 | TZ_floor | 29.6 |
| 2012-10-09 | TZ_road | 37.8 |
| 2012-10-09 | TZ_tower | 34.7 |
No TZ Moisture Point data found
No VR Moisture Point data found
No TZ grass heigth found
No VR grass heigth found
Tree DBH
| Date | Tag# | Reading (mm) |
|---|---|---|
| 2012-10-09 | 1 | 21.5 |
| 2012-10-09 | 102 | 14.9 |
| 2012-10-09 | 2 | 14.4 |
| 2012-10-09 | 245 | 10 |
| 2012-10-09 | 3 | 18.1 |
| 2012-10-09 | 4 | 3 |
| 2012-10-09 | 5 | 23.9 |
| 2012-10-09 | 7 | 15.2 |
| 2012-10-09 | 72 | 10.6 |
| 2012-10-09 | 79 | 10.2 |
| 2012-10-09 | 8 | 6.6 |
Water Potential - mode: raw
| Time | Species | Tree | readings (bar) | |||||
|---|---|---|---|---|---|---|---|---|
| 2012-10-09 05:40:00 | OAK | UNKNOWN | -55 | -55 | -40 | -27 | -20 | -25 |
| 2012-10-09 05:40:00 | PINE | UNKNOWN | -15 | -10 | -22 | -22 | -27 | -10 |
| 2012-10-09 10:40:00 | OAK | UNKNOWN | -65 | -45 | -41 | -38 | -42 | -37 |
| 2012-10-09 10:40:00 | PINE | UNKNOWN | -21 | -20 | -12 | -25 | -6 | -10 |
| 2012-10-09 12:40:00 | OAK | UNKNOWN | -52 | -33 | -41 | -33 | -35 | |
| 2012-10-09 12:40:00 | PINE | UNKNOWN | -7 | -7 | -6 | -6.5 | -7 | -22 |
No TZ Grass Biomass data found
No TZ OakLeaves Biomass data found
No TZ PineNeedles Biomass data found
3 photos found

20121009TZ_FloorCR1000.jpg ( 2012-10-09 08:36:39 ) Full size: 1920x1440
New CR1000 for flux at Tonzi Floor

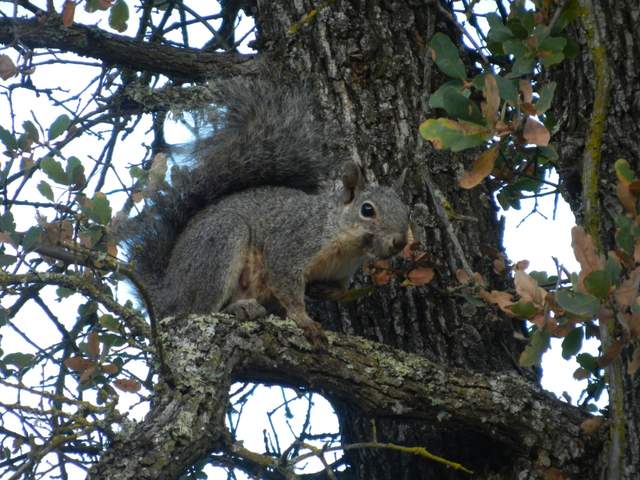
20121009TZ_Squirrel.jpg ( 2012-10-09 07:25:19 ) Full size: 1920x1440
Grey squirrel

20121009TZ_TowerCR1000.jpg ( 2012-10-09 11:39:11 ) Full size: 1920x1440
New CR1000 for flux at the top of Tonzi Tower.
16 sets found
No data found for TZ_Fenergy.
11 TZ_tmet graphs found
11 TZ_soilco2 graphs found
Can't check TZ_mixed
3 TZ_mixed graphs found
1 TZ_fflux graphs found
8 TZ_fmet graphs found
1 TZ_tram graphs found
3 TZ_co2prof graphs found
No data found for TZ_irt.
No data found for TZ_windprof.
1 TZ_tflux graphs found
2 TZ_sm graphs found
Can't check TZ_met
1 TZ_met graphs found
Can't check TZVR_mixed
8 TZ_osu graphs found
No data found for TZ_fd.
Tonzi Z-cam data

