
Field Notes
<--2012-09-13 14:00:00 | 2012-09-27 13:30:00-->Other sites visited today: Sherman Island | Twitchell Rice | Mayberry | West Pond
Phenocam link: Searching...
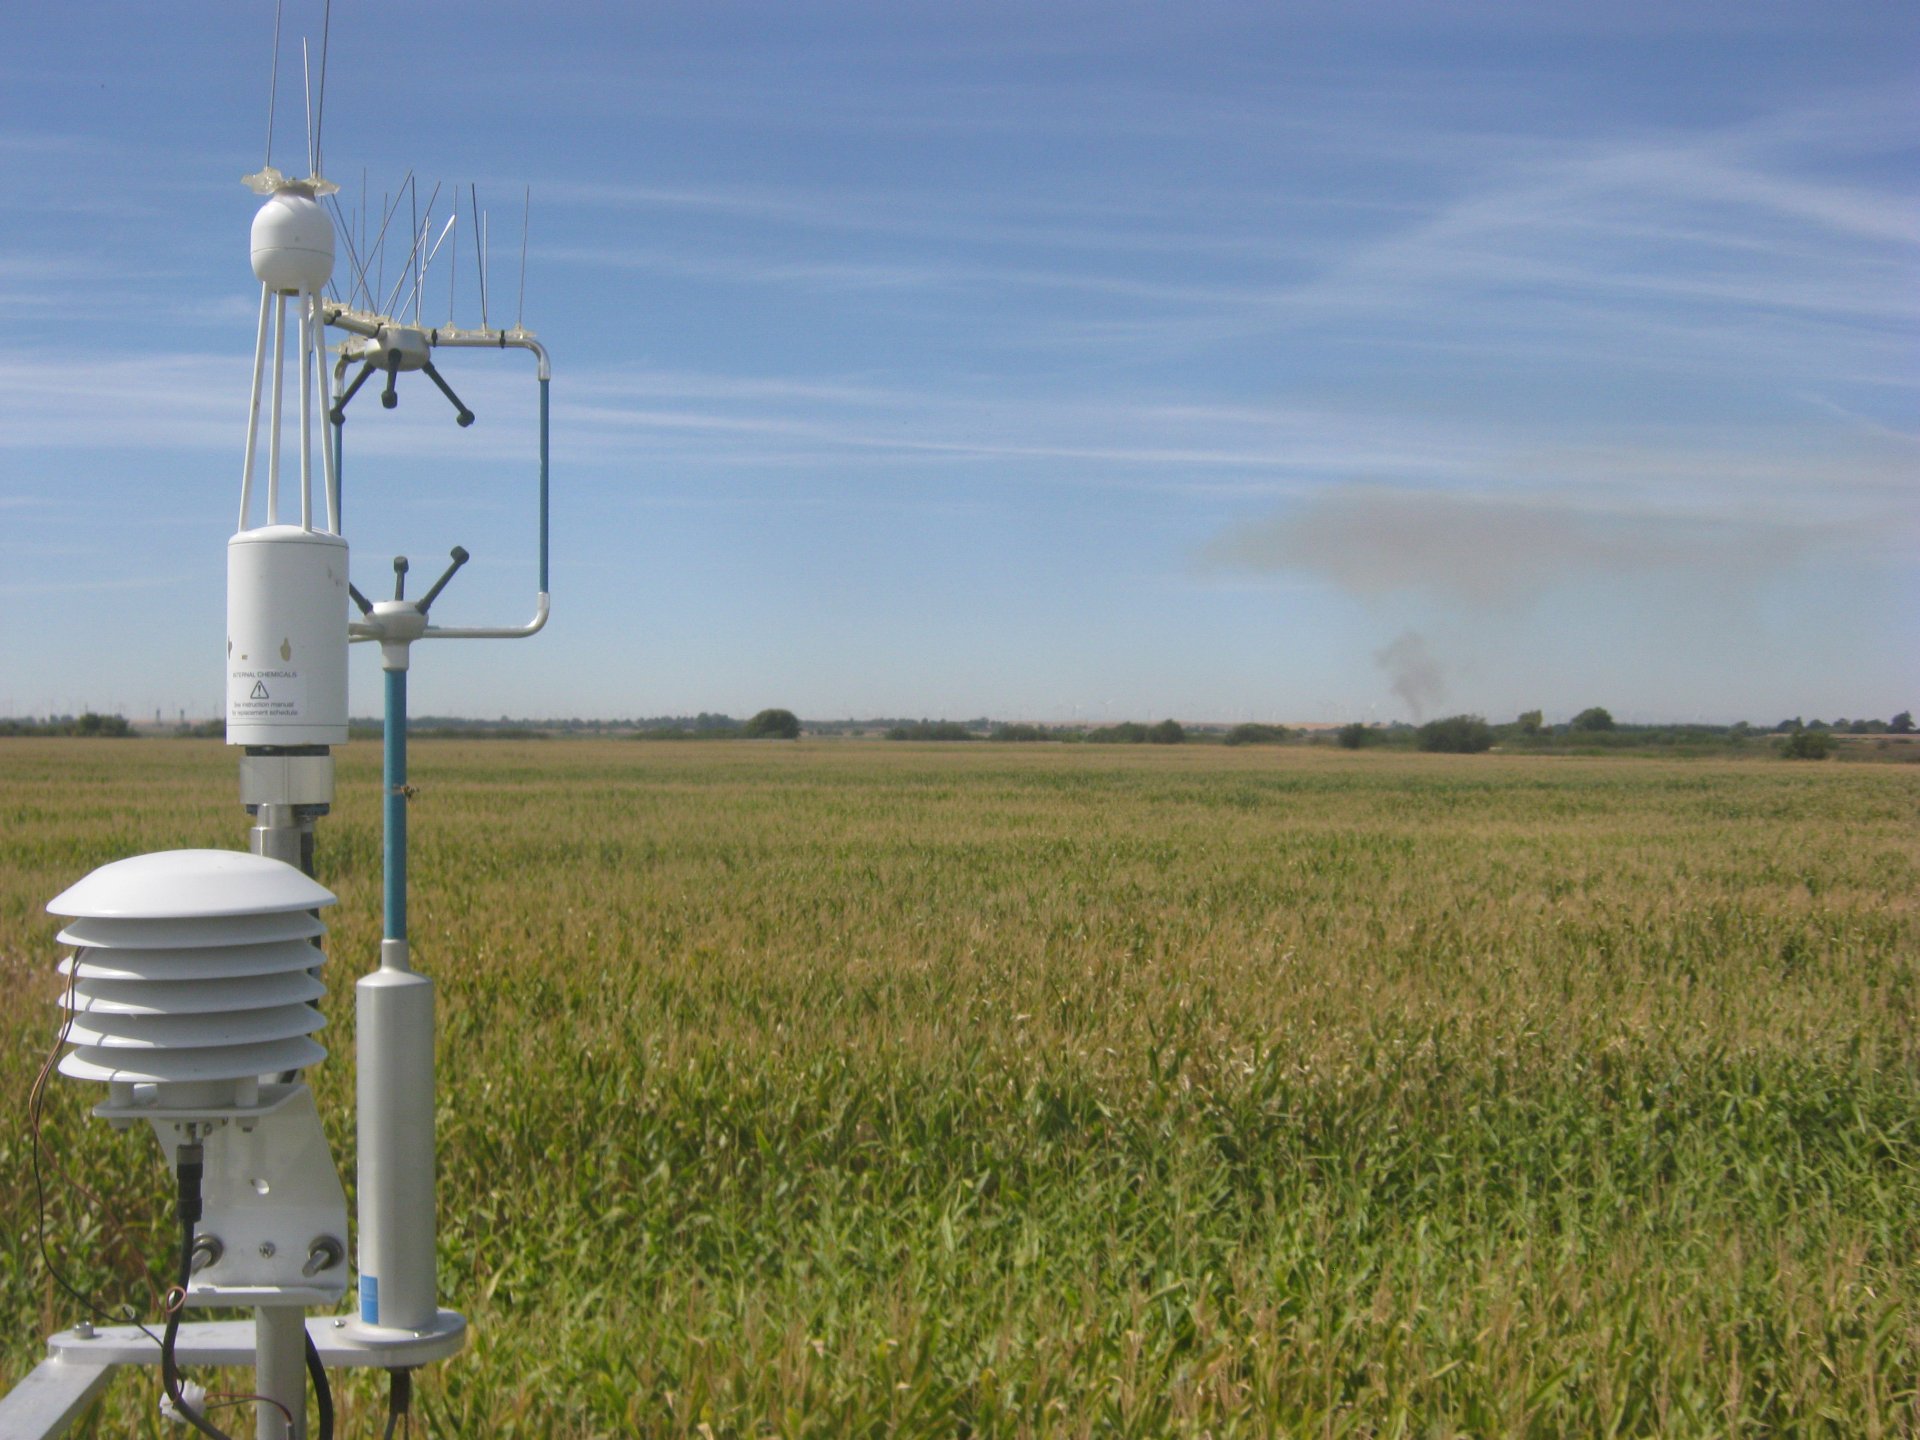
DWR Corn: 2012-09-20 13:00:00 (DOY 264)
Author: Cove Sturtevant
Others: Sara, Laurie
Summary: Corn is generally dry but still some green, 4-band radiometer PRT looks good after tightening connection in datalogger, Vaisala Temp/RH was about 0.5 C & 1.5% low, respectively, compared to standard.
| DWR Corn
2012-09-20 We arrived around 13:00 PDT. Sunny, warm, mild breeze. The corn looked similar to last week if not a bit drier, but still some green showing. We all checked the tower since Laurie and Sara only needed to do spectral (with the same computer). The wasps are active on the southeast side of the tower, but not as bad as last week and they didn’t bother me up in the northwest corner. Tower readings: CO2: 15.8 mmol m-3 H2O: 570 mmol m-3 diag: 248 Sara tightened up the screws holding the wires coming from 4-band radiometer PRT into the MET CR1000. Afterward, the temperature from the PRT looked as expected, about 3 °C higher than air temperature given the radiation load. All other MET looked good. I tightened up and did general housekeeping on most of the other wires attached to the datalogger. I checked the tower Vaisala against the standard again this week, keeping the probe out of the sun beforehand. It took a couple minutes to settle. The tower Vaisala temperature was about 0.5 °C lower than the standard, and RH from the tower was about 1.5 percentage point lower than the standard. Standard: T = 25.5 °C; RH = 40% Tower probe: T = 24.7 °C before, 25.2 °C after; RH = 38.6% before, 38.3% after |
1 photos found
DC_autocam_20120921_1245.jpg ( 2012-09-21 12:45:03 ) Full size: 1920x1440
Smoke on the horizon
3 sets found
Can't check DC_mixed
3 DC_mixed graphs found
7 DC_met graphs found
3 DC_flux graphs found