Field Notes
<--2012-08-08 16:30:00 | 2012-09-05 07:30:00-->Other sites visited today: Tonzi | Tonzi
Phenocam link: Searching...
Vaira: 2012-08-22 10:30:00 (DOY 235)
Author: Joe Verfaillie
Others: Siyan, Sunny
Summary: Added CR1000 to collect flux data, removed old web cam, reset computer clock and data logger clocks, lots of brown leaves.
| Vaira
2012-08-22 I arrived about 10:30 with Siyan and Sunny. It was clean, sunny and hot with a light breeze from the west. Many of the trees have brown leaves. Not so much a scattering of brown leaves on all trees but more of individual trees being mostly brown. The leaves were brown and dead looking and not so yellow and senescent. This was visible in trees from Twin Cities Road all the way to Tonzi. There may be less brown leaves here than at Tonzi. The clock on the computer was 1 hour ahead set to PDT last time I was here (8-8) after it crashed and lossed its clock. The flux, soil CO2 and met were all on the bad time. Also, the met CR23X was an additional 15min ahead due to an offset that got put in the wrong part of its setup. The data loggers are supposed to have their clocks adjusted at 15 minutes past midnight, but the met data logger had a time zone offset of 15 minutes. When the data logger clock read 11:05 it was reset to 10:50. I added a CR1000 data logger in the box with the sonic power and communication interface to collect the flux data in parallel with the computer. The binary, serial message from the sonic is being split and sent to both the data logger and the computer. Additionally the SDM data from the 7500 is being recorded by the CR1000. I removed the fine wire thermocouple from the flux system. I removed the old web cam. I disconnected it from the power relay that is still running the Phenocam. The USC guys put in a couple of fence posts behind the solar panels to mount a mast with and antenna and some electronics. I think the electronics will be mounted later, but there is a small solar panel and battery there. They made a little mess of the nearby ground, but it doesn’t look like they disturbed anything vital. There are only about four remote nodes visible from the tower location. |
Field Data
No tank data
Well Depth
| Date | Location | Depth (feet) |
|---|---|---|
| 2012-08-22 | TZ_floor | 27.4 |
| 2012-08-22 | TZ_road | 36.3 |
| 2012-08-22 | TZ_tower | 32 |
No TZ Moisture Point data found
No VR Moisture Point data found
No TZ grass heigth found
No VR grass heigth found
No VR Tree DBH found
No water potential data found
No VR Grass Biomass data found
No VR OakLeaves Biomass data found
No VR PineNeedles Biomass data found
8 photos found
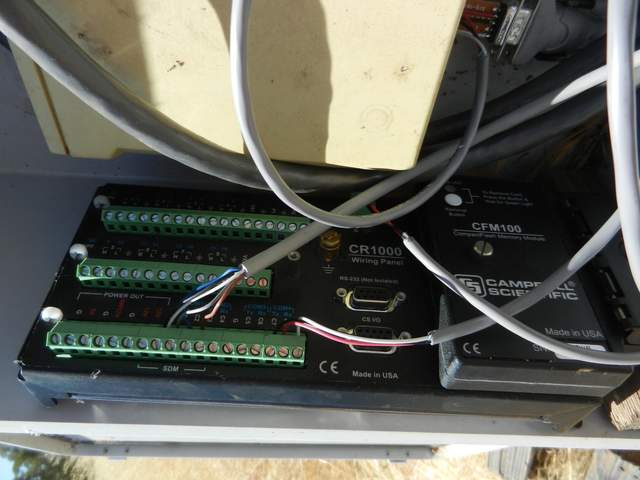
20120822VR_CR1000.jpg ( 2012-08-22 12:32:27 ) Full size: 1920x1440
CR1000 data logger in eddy box
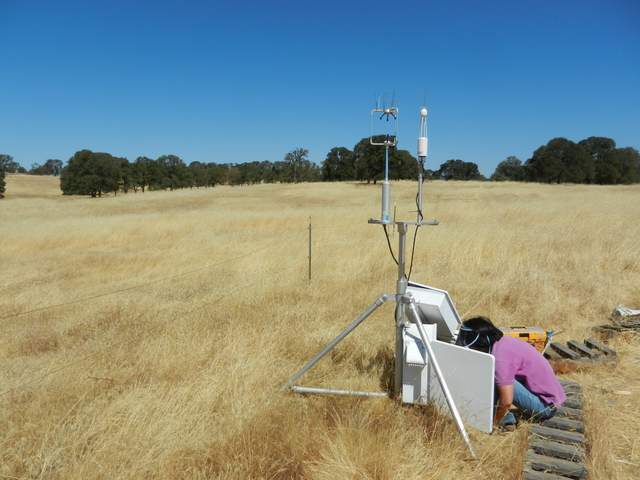
20120822VR_SiyanTowerNorth.jpg ( 2012-08-22 11:42:08 ) Full size: 1920x1440
Siyan working at the Vaira eddy tower surrounded by yellow grass
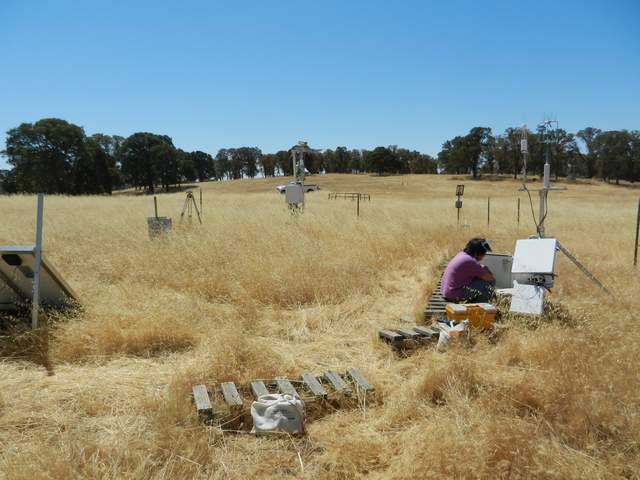
20120822VR_SiyanTowerSouth.jpg ( 2012-08-22 11:41:00 ) Full size: 1920x1440
Siyan working at the Vaira eddy tower surrounded by yellow grass
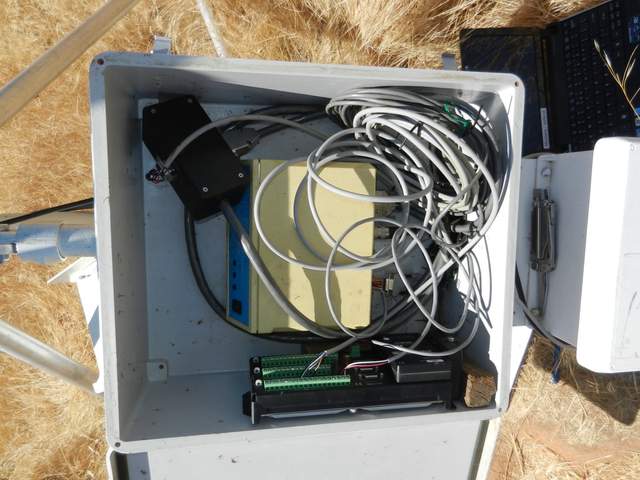
20120822VR_SonicPCIBox.jpg ( 2012-08-22 12:32:15 ) Full size: 1920x1440
Wiring inside sonic PCI box
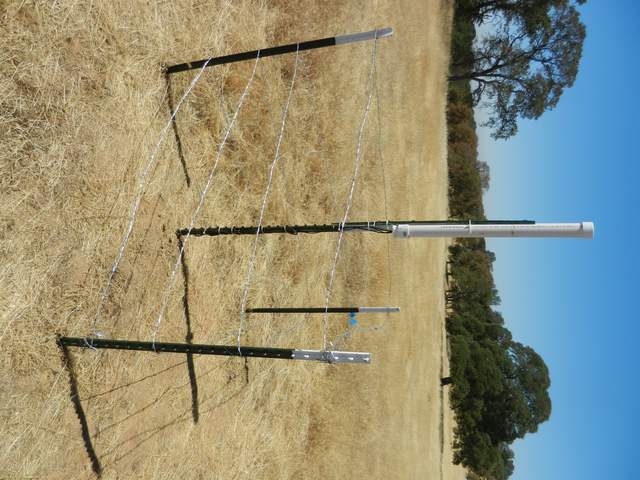
20120822VR_USCRemoteNode.jpg ( 2012-08-22 12:38:21 ) Full size: 1920x1440
SMAP remote soil moisture monitoring station
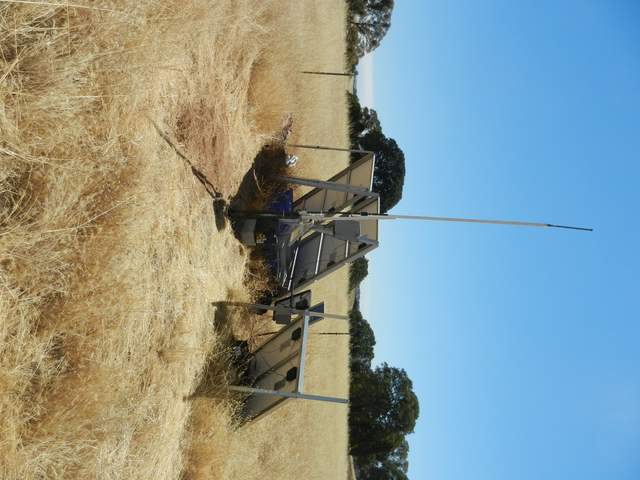
20120822VR_USCSpotMast.jpg ( 2012-08-22 11:41:39 ) Full size: 1920x1440
The back side of the Vaira solar panles
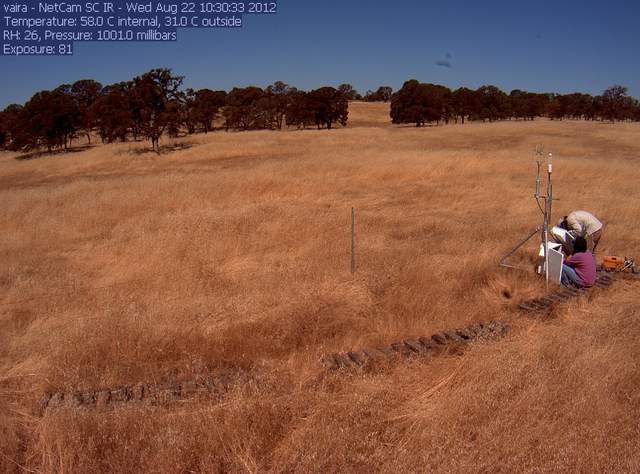
vaira_2012_08_22_103101.jpg ( 2012-08-22 11:25:48 ) Full size: 1296x960
Joe and Siyan at the site.
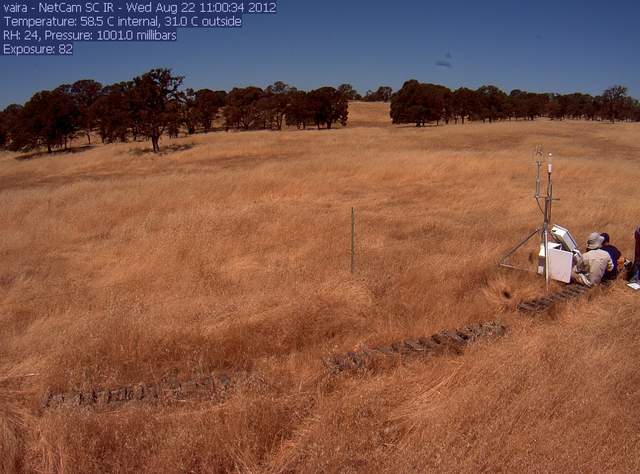
vaira_2012_08_22_110102.jpg ( 2012-08-22 10:55:40 ) Full size: 1296x960
Joe, Sunny and Siyan on site
9 sets found
16 VR_met graphs found
2 VR_flux graphs found
6 VR_soilco2 graphs found
No data found for VR_pond.
Can't check TZVR_mixed
No data found for VR_fd.
No data found for VR_processed.
No data found for VR_arable.
No data found for VR_soilvue.

