
Field Notes
<--2012-08-08 10:30:00 | 2012-08-22 10:30:00-->Other sites visited today: Vaira | Tonzi
Phenocam link: Searching...
Tonzi: 2012-08-22 10:00:00 (DOY 235)
Author: Joe Verfaillie
Others: Siyan, Martin, Nhat, Sunny
Summary: Martin did leaf survey, Siyan did standard field work, I removed the old web cam, the co2 profile pump was stuck and restarted, lots of brown leaves.
| Tonzi
2012-08-22 I arrived about 10:00am PDT with Martin, Siyan, Nhat and Sunny. It was clear, sunny and warm on its way to hot. There was a light breeze from the west. Many of the trees have brown leaves. Not so much a scattering of brown leaves on all trees but more of individual trees being mostly brown. The leaves were brown and dead looking and not so yellow and senescent. This was visible in trees from Twin Cities Road all the way to Tonzi. There are acorns on the trees, but not as many as last year. We unloaded and assembled the scaffolding for Martin’s leaf survey work and then went to Vaira. We returned from Vaira about 12:45pm PDT. Siyan did midday water potential. The existing tanks at the water potential only had about 500psi in them – not enough for the dry conditions. So we borrowed the CO2 tank from the CO2 profile system on the tower that had 1000psi. The pump for the CO2 profile system was not running. I banged on it and it started up again. Probable carbon buildup inside is blocking the brushes. New pumps should be here next week. Otherwise the system seemed to be running okay. I removed the old web cam from the tower. It was plugged into the 5V channel on the CR23X. The Phenocam is running on the SW12V port of the 23X. The radiation sensors looked clean The Tram was running. Both the Floor and Tower computers restarted when Siyan tried to collect data. The USC soil moisture equipment (small solar panel, battery, antenna and two small equipment boxes) are mounted on the tower on the level below the CO2 profile equipment. Walking around on the ground I could only see four or the remote nodes. Z-cam windows looked clean. We saw Mr Tonzi as he headed out to a neighbor’s for dinner. He looked well. |
Field Data
No tank data
Well Depth
| Date | Location | Depth (feet) |
|---|---|---|
| 2012-08-22 | TZ_floor | 27.4 |
| 2012-08-22 | TZ_road | 36.3 |
| 2012-08-22 | TZ_tower | 32 |
No TZ Moisture Point data found
No VR Moisture Point data found
No TZ grass heigth found
No VR grass heigth found
Tree DBH
| Date | Tag# | Reading (mm) |
|---|---|---|
| 2012-08-22 | 1 | 21.8 |
| 2012-08-22 | 102 | 13.9 |
| 2012-08-22 | 2 | 14.5 |
| 2012-08-22 | 245 | 10 |
| 2012-08-22 | 3 | 18.2 |
| 2012-08-22 | 4 | 3.1 |
| 2012-08-22 | 5 | 23.9 |
| 2012-08-22 | 7 | 15.5 |
| 2012-08-22 | 72 | 11.1 |
| 2012-08-22 | 79 | 10.9 |
| 2012-08-22 | 8 | 6.7 |
No water potential data found
No TZ Grass Biomass data found
No TZ OakLeaves Biomass data found
No TZ PineNeedles Biomass data found
7 photos found
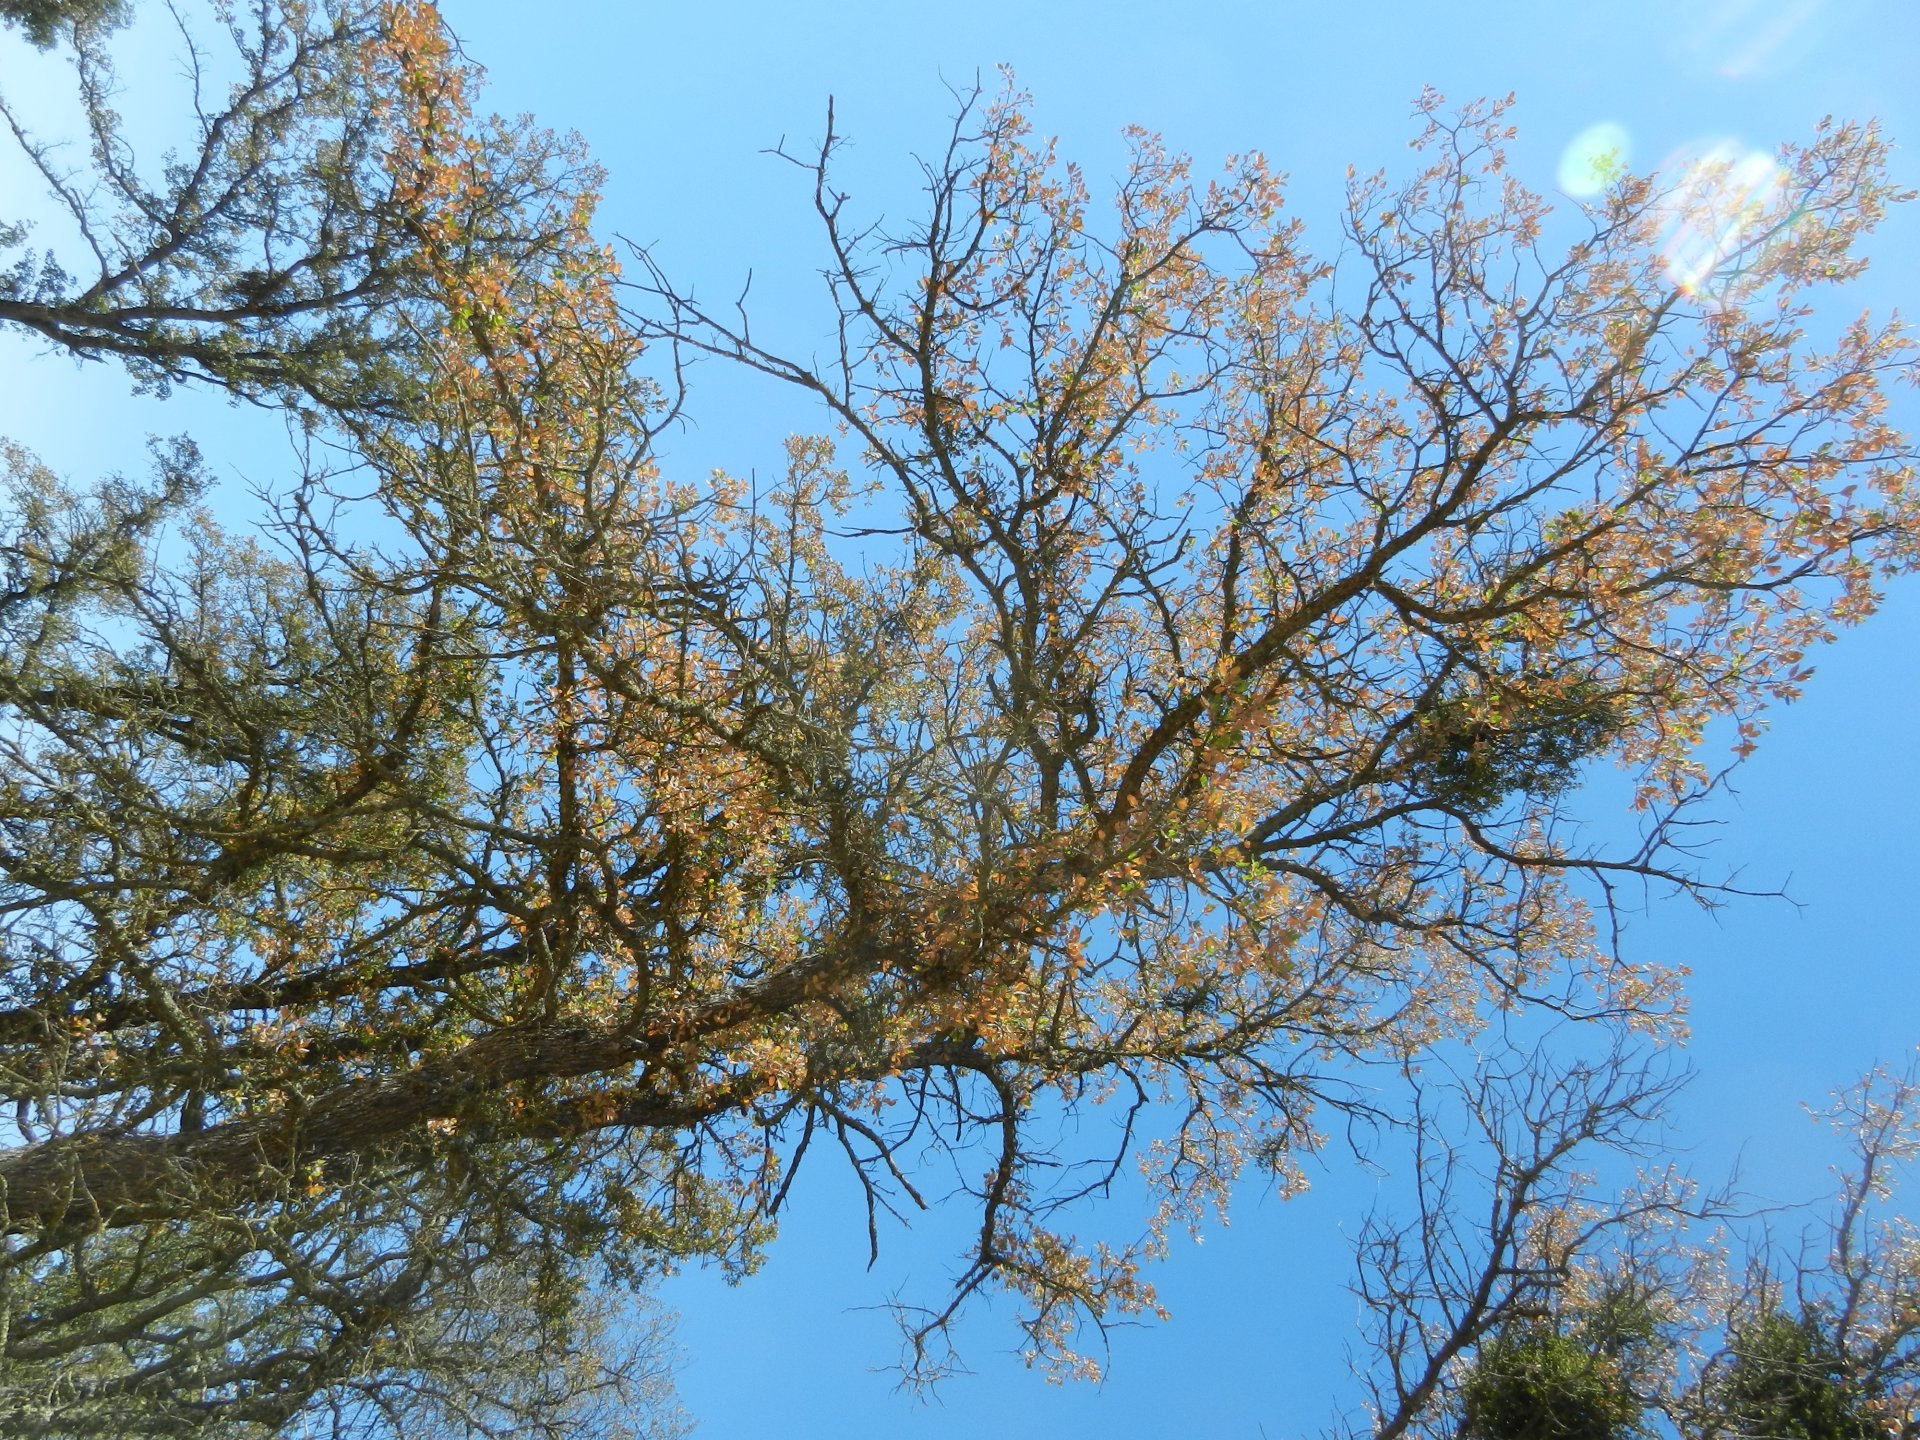
20120822TZ_BrownLeaves.jpg ( 2012-08-22 14:47:25 ) Full size: 1920x1440
Brown oak leaves on the trees
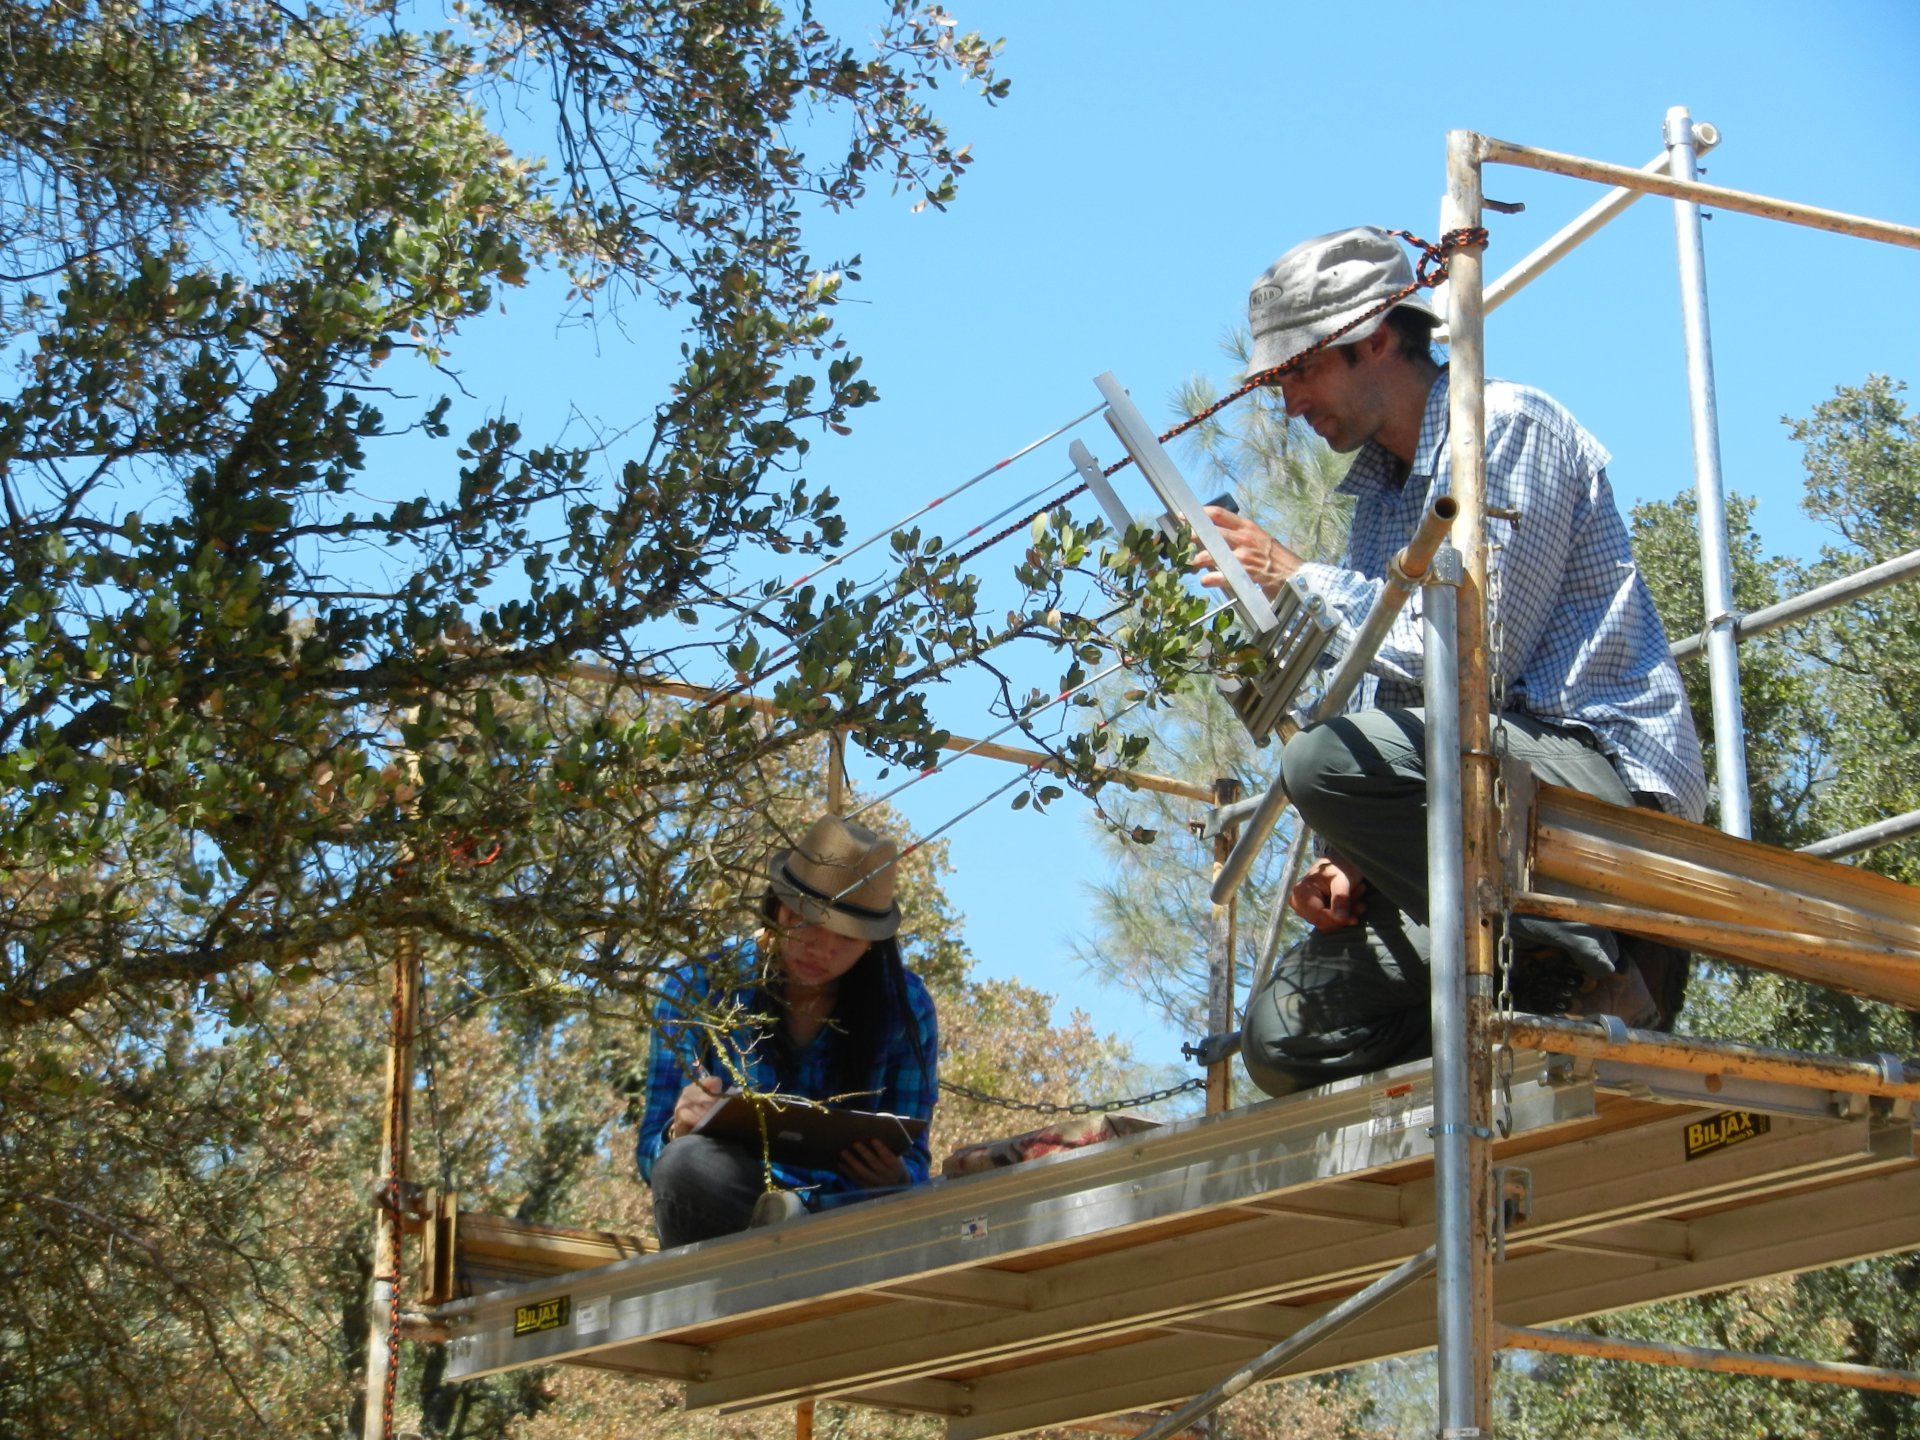
20120822TZ_MartinNhat.jpg ( 2012-08-22 14:50:24 ) Full size: 1920x1440
Martin and Nhat on scaffolding for oak leaves
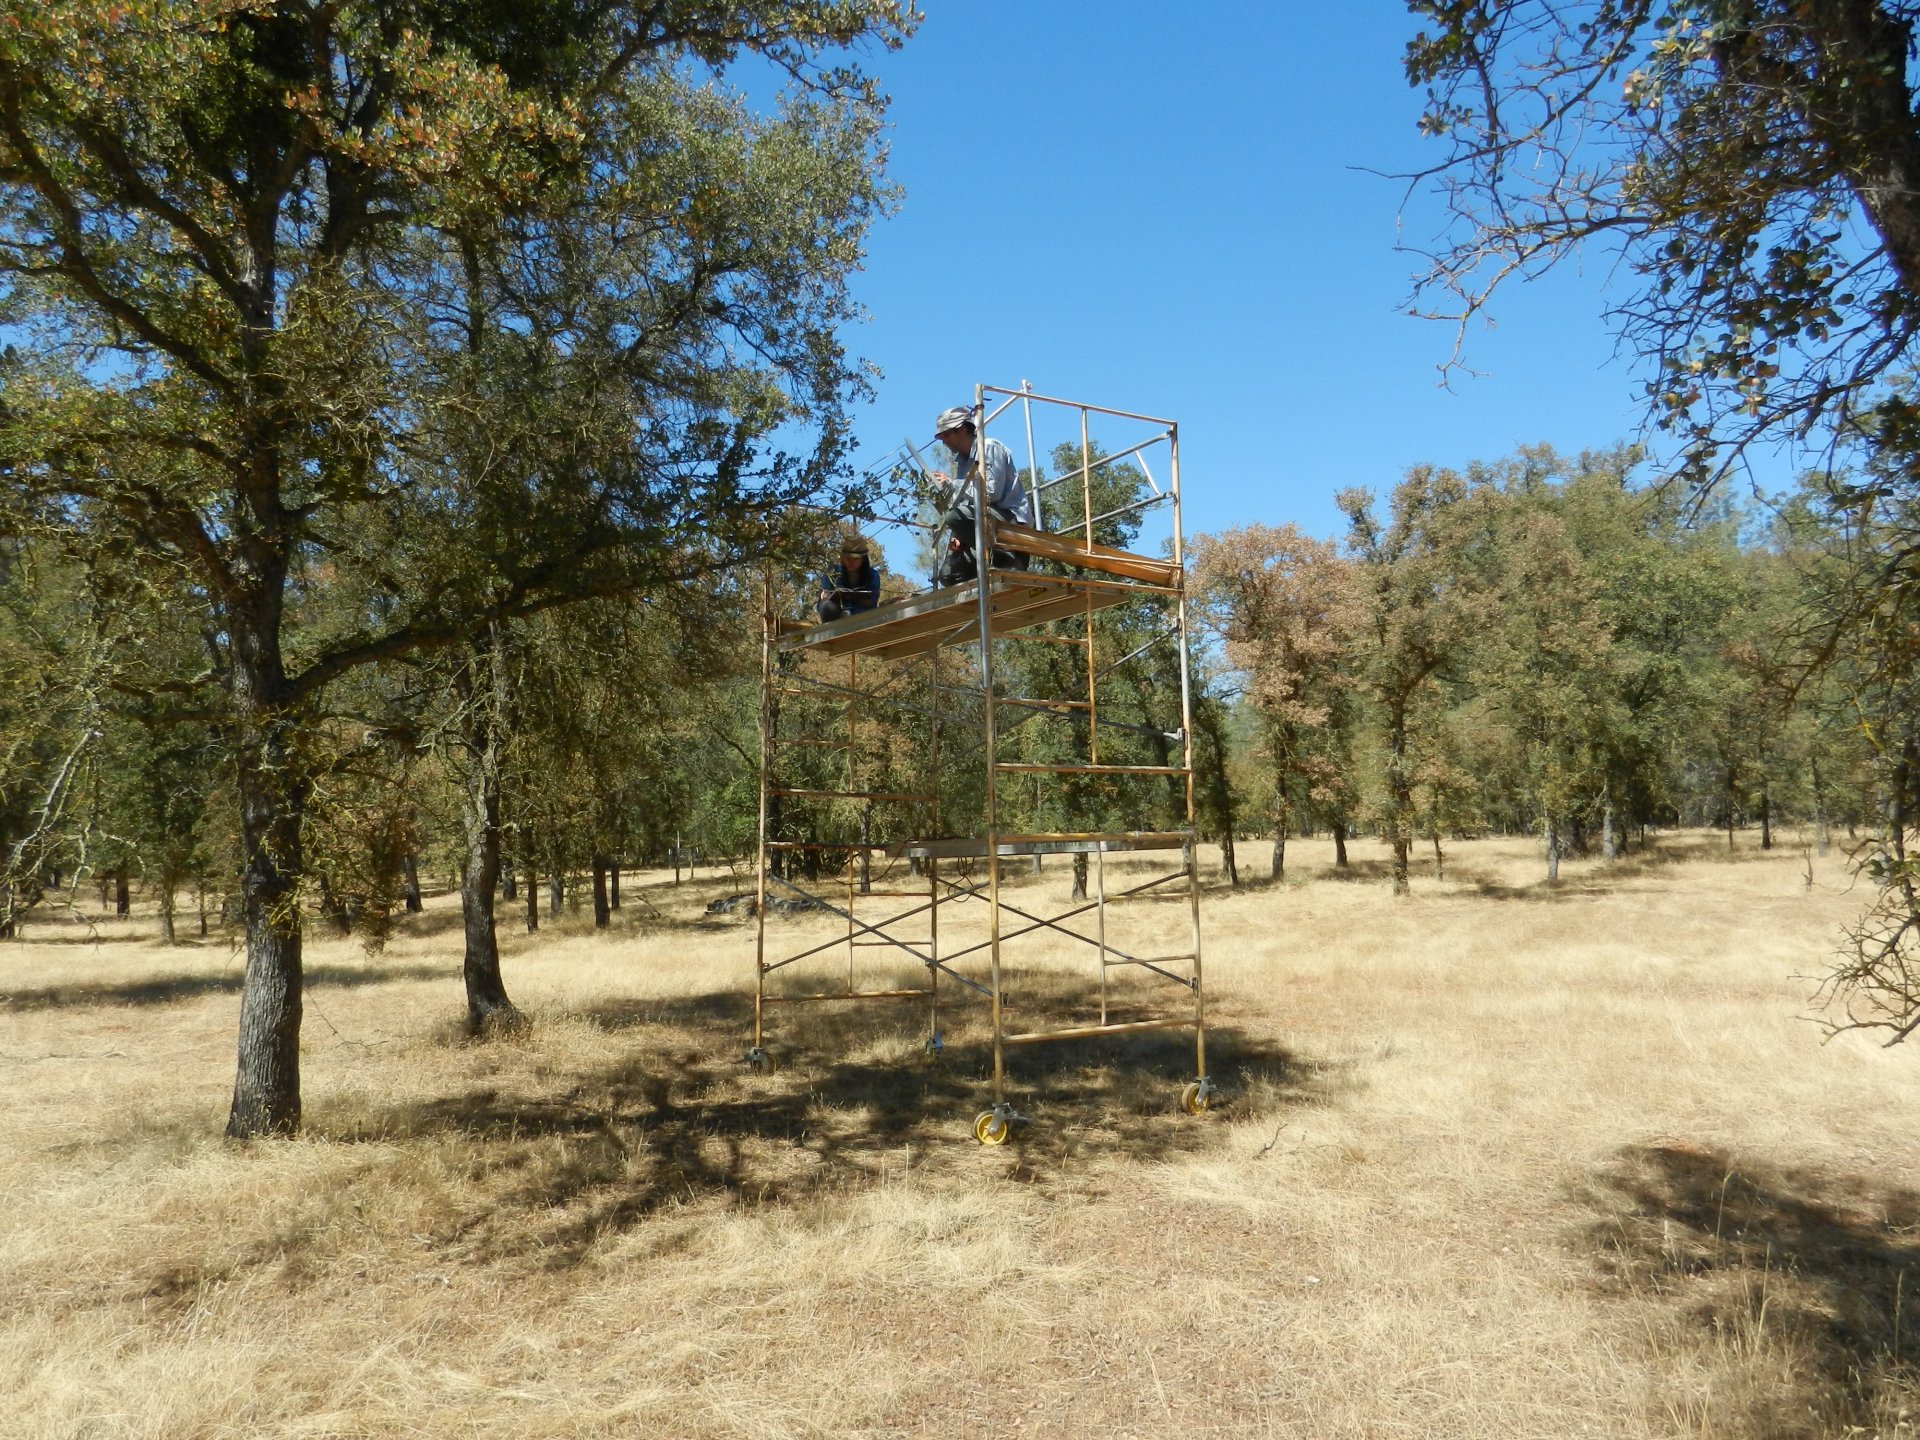
20120822TZ_Scaffolding.jpg ( 2012-08-22 14:50:12 ) Full size: 1920x1440
Martin making clumping measurements on scaffolding
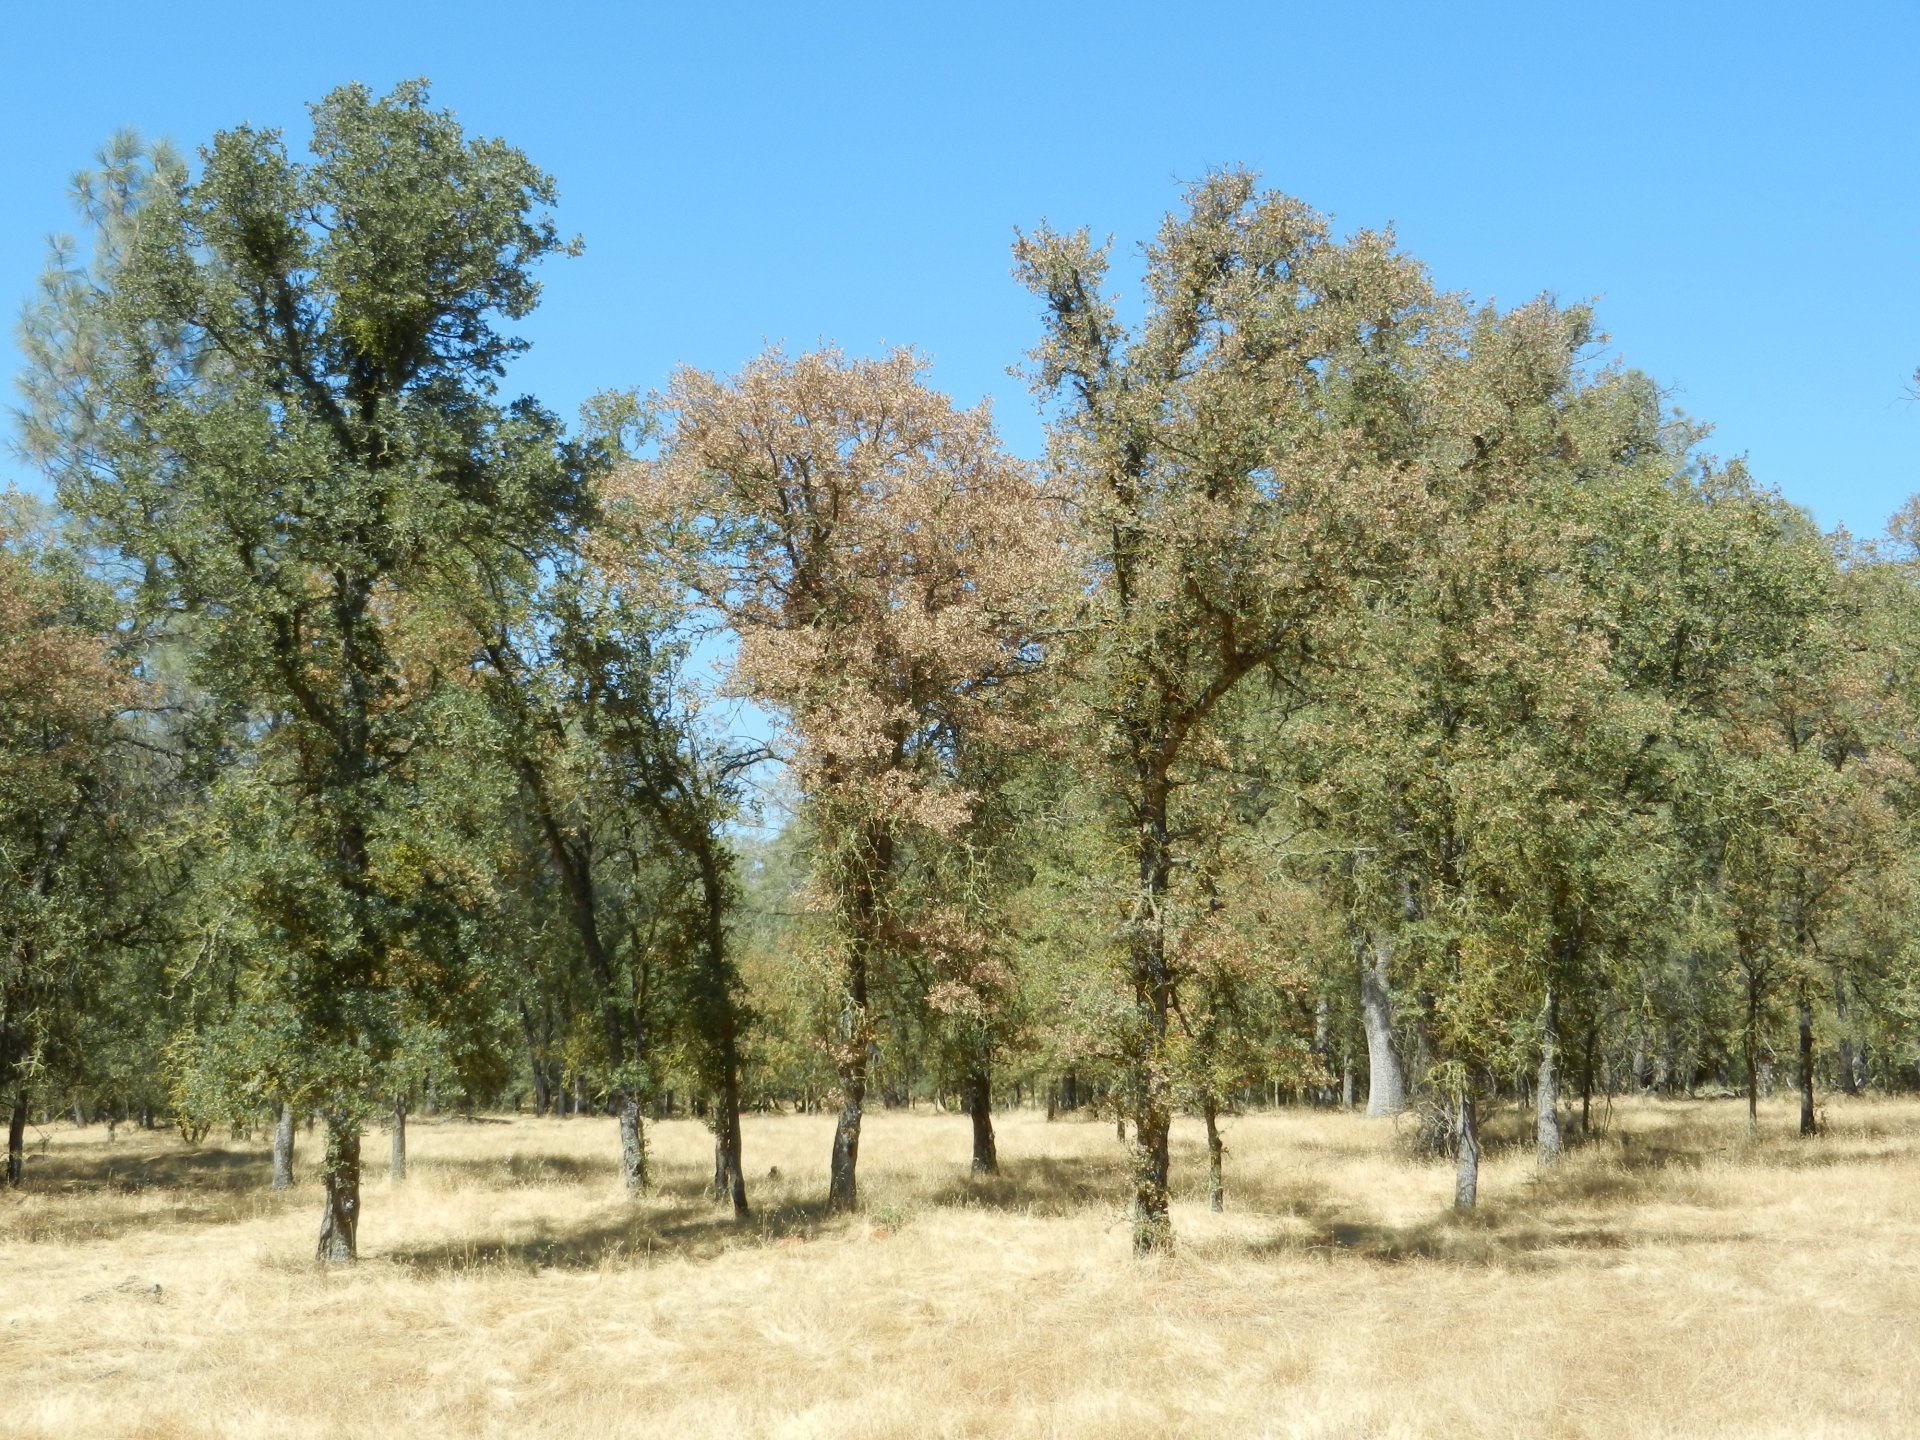
20120822TZ_TreeWithBrownLeaves.jpg ( 2012-08-22 14:51:41 ) Full size: 1920x1440
One oak tree with particularly brown leaves
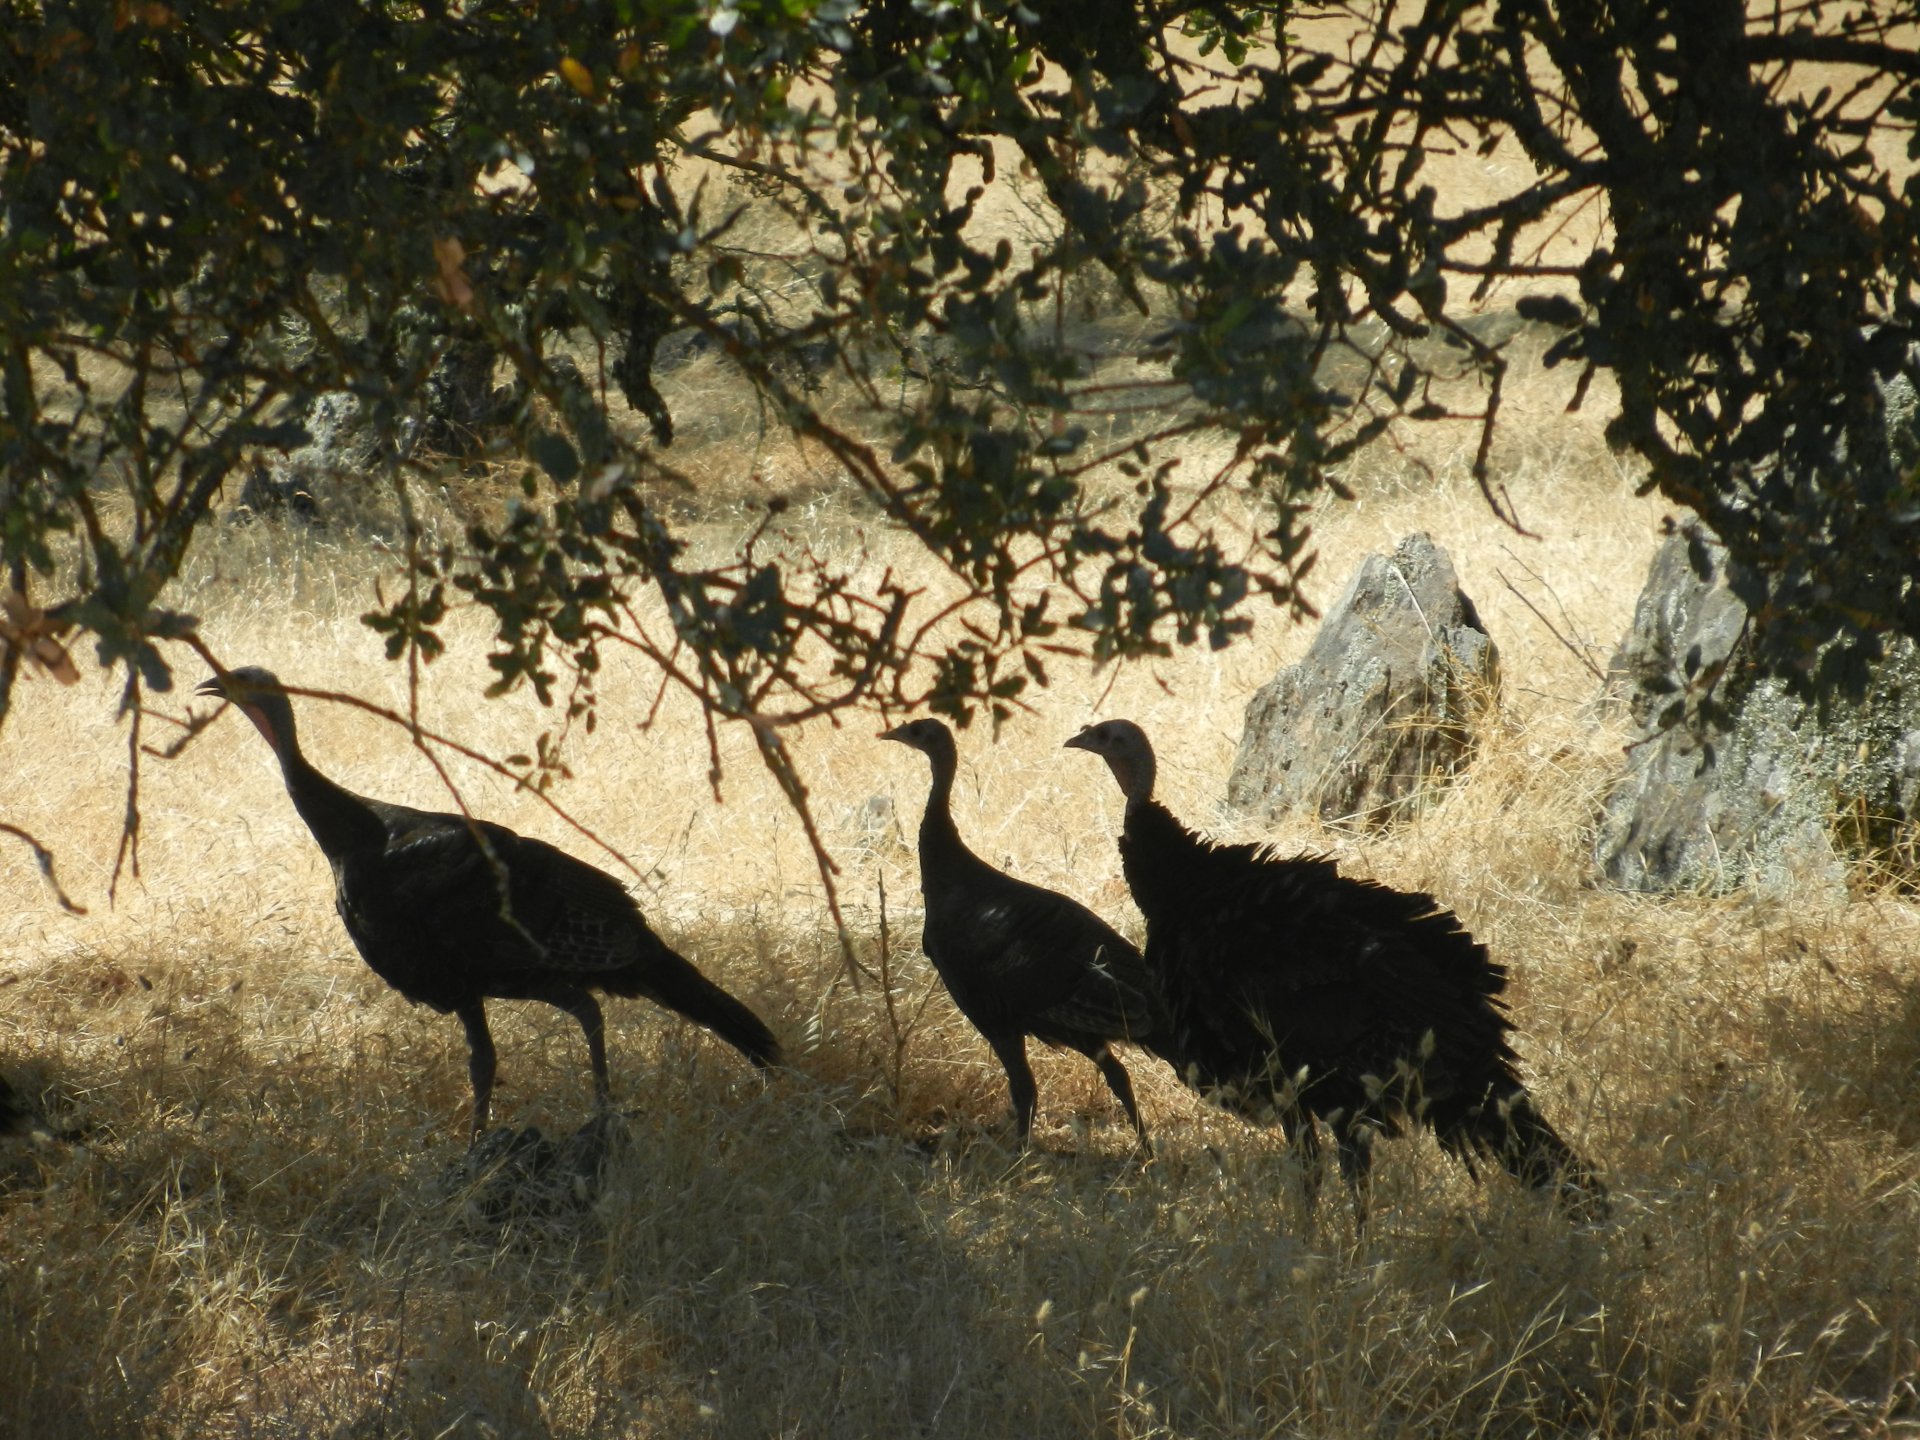
20120822TZ_Turkeys1.jpg ( 2012-08-22 11:06:40 ) Full size: 1920x1440
Wild turkeys under the trees
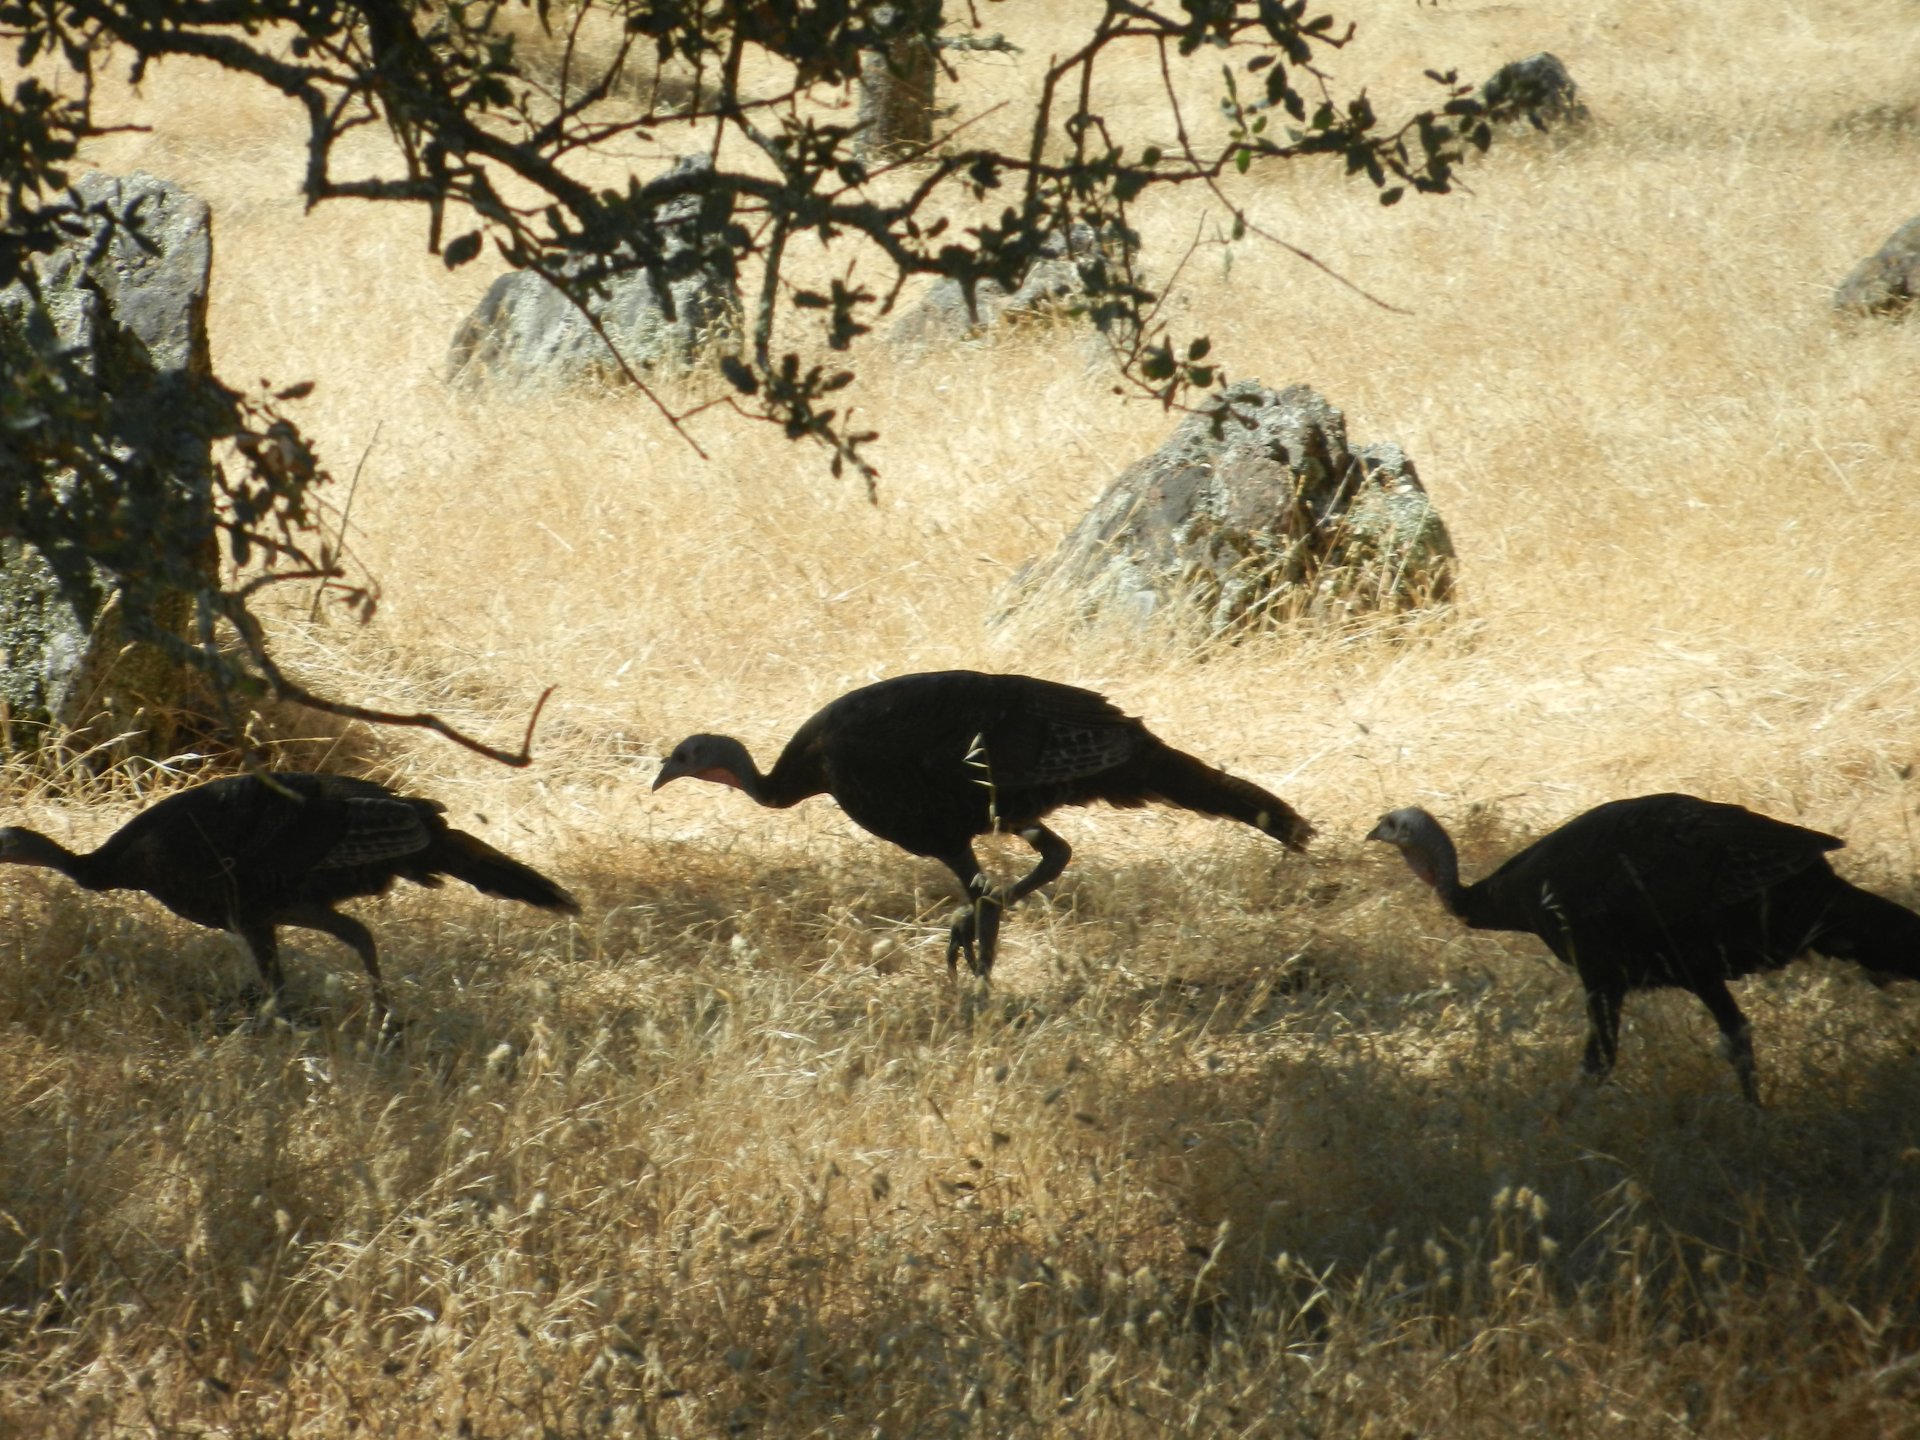
20120822TZ_Turkeys2.jpg ( 2012-08-22 11:06:30 ) Full size: 1920x1440
Wild turkeys under the trees
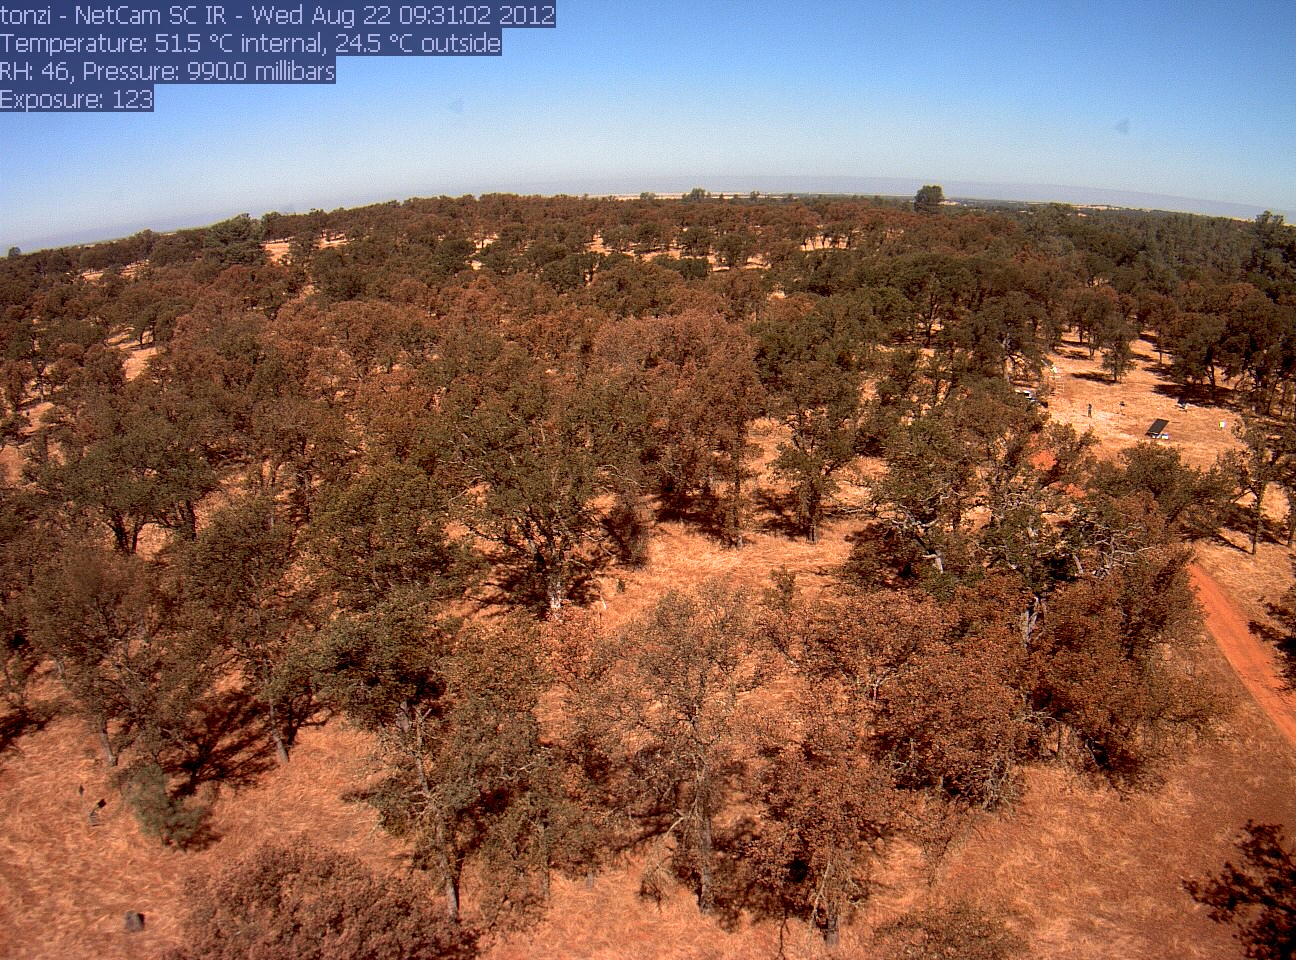
tonzi_2012_08_22_093102.jpg ( 2012-08-22 09:28:40 ) Full size: 1296x960
Field work
16 sets found
No data found for TZ_Fenergy.
11 TZ_tmet graphs found
11 TZ_soilco2 graphs found
Can't check TZ_mixed
3 TZ_mixed graphs found
1 TZ_fflux graphs found
8 TZ_fmet graphs found
1 TZ_tram graphs found
3 TZ_co2prof graphs found
No data found for TZ_irt.
No data found for TZ_windprof.
1 TZ_tflux graphs found
2 TZ_sm graphs found
Can't check TZ_met
1 TZ_met graphs found
Can't check TZVR_mixed
8 TZ_osu graphs found
No data found for TZ_fd.
Tonzi Z-cam data