Field Notes
<--2012-07-10 09:00:00 | 2012-08-22 10:30:00-->Other sites visited today: Tonzi
Phenocam link: Searching...
Vaira: 2012-08-08 16:30:00 (DOY 221)
Author: Joe Verfaillie
Others: USC
Summary: USC soil moisture orientation, fixed overheating computer.
| Vaira
2012-08-09 I arrived about 4:30PM PDT with a group from USC. It was clear, sunny and hot with little to no breeze. The grass is very yellow and brittle dry. The USC group will be installing a base station (spot) on a small tower directly behind the solar panels and up to 30 remote notes in the surrounding area within 300m of the tower. The USC group only stayed 15 minutes or so, but will be working at Vaira throughout the next week or so. I checked on the computer and found is baking hot. The power light was on but the screen got no signal. I turned the computer off and it would not restart. The bottom of the computer case was almost too hot to touch. I got an ice pack from my lunch box and was able to cool the computer down. Opening the case I found that the internal fan was disconnected. I remember doing this during the winter because the fan had been modified to run only at full speed and was using too much power. I happened to have a spare fan which I didn’t use at Tonzi. I replaced the fan and the computer restarted. All seemed well. Data was lost from 8-2 to 8-8. I had to reset the computer's clock and I may have set it to daylight savings time - need to check this next time. I reseated the Ethernet cable for the stardot camera which had come loose several weeks ago. |
Field Data
No tank data
No VR Well data found
No TZ Moisture Point data found
No VR Moisture Point data found
No TZ grass heigth found
No VR grass heigth found
No VR Tree DBH found
No water potential data found
No VR Grass Biomass data found
No VR OakLeaves Biomass data found
No VR PineNeedles Biomass data found
1 photos found

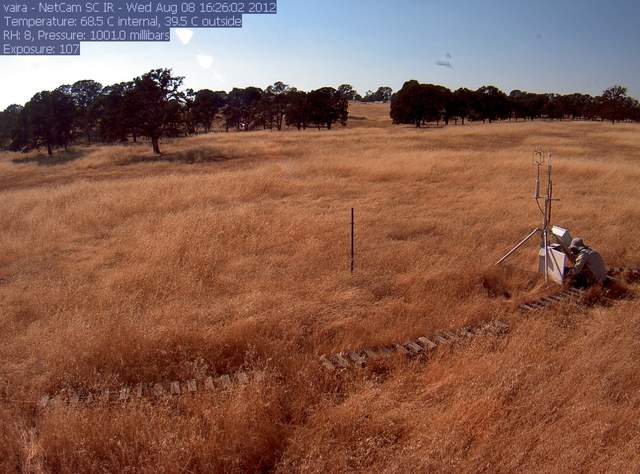
vaira_2012_08_08_162611.jpg ( 2012-08-08 17:20:12 ) Full size: 1296x960
Joe at the site
9 sets found
16 VR_met graphs found
2 VR_flux graphs found
6 VR_soilco2 graphs found
No data found for VR_pond.
Can't check TZVR_mixed
No data found for VR_fd.
No data found for VR_processed.
No data found for VR_arable.
No data found for VR_soilvue.

