Field Notes
<--2012-08-22 10:30:00 | 2012-09-19 07:00:00-->Other sites visited today: Tonzi
Phenocam link: Searching...
Vaira: 2012-09-05 07:30:00 (DOY 249)
Author: Joe Verfaillie
Others: Siyan
Summary: Swapped CR1000 card, added serail port for CR1000, removed SHF plate for calibration.
| Vaira
2012-09-05 I arrived with Siyan about 7:30. On the way up in the dark there were flashes of lightening visible to the south. It was mostly cloudy overhead and very dark with some thunder to the east, but to the west it was mostly clear. The dead grasses are still golden and the trees are beginning to brown. I added a new USB to serial adapter to the computer to connect to the CR1000. We swapped the card on the CR1000. I removed SHF plate #1 (sn 001603 60.3uv/(W/m2)) for calibration. It was buried partly under the end of the PVC conduit and under a gopher mound about 10cm below the ground surface. I put a jump in to zero out the channel. Siyan did the standard fieldwork. The radiation sensors were clean. |
Field Data
No tank data
Well Depth
| Date | Location | Depth (feet) |
|---|---|---|
| 2012-09-05 | TZ_floor | 28.2 |
| 2012-09-05 | TZ_road | 36.8 |
| 2012-09-05 | TZ_tower | 32.7 |
No TZ Moisture Point data found
No VR Moisture Point data found
No TZ grass heigth found
No VR grass heigth found
No VR Tree DBH found
No water potential data found
No VR Grass Biomass data found
No VR OakLeaves Biomass data found
No VR PineNeedles Biomass data found
3 photos found

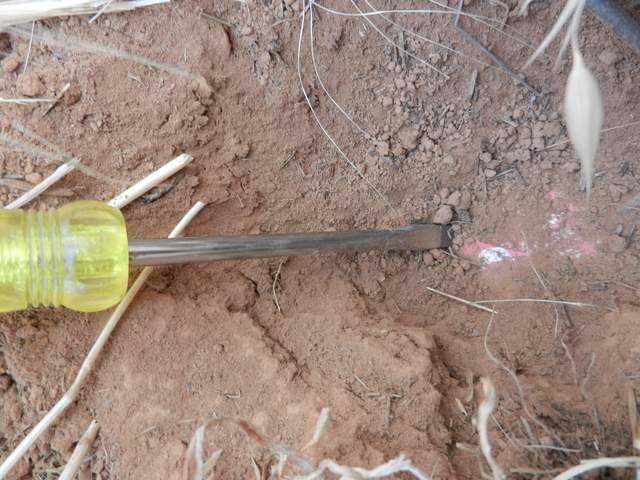
20120905VR_SHFPlateDepth.jpg ( 2012-09-05 08:07:52 ) Full size: 1920x1440
Depth to recovered soil heat flux plate

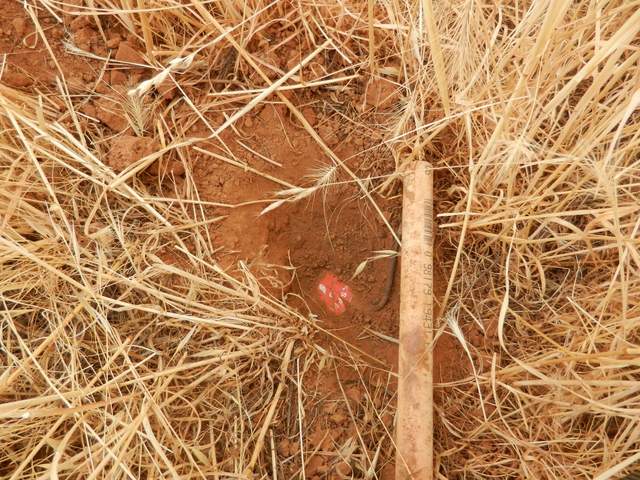
20120905VR_SHFPlatePosition.jpg ( 2012-09-05 08:08:17 ) Full size: 1920x1440
Location of a soil heat flux plate

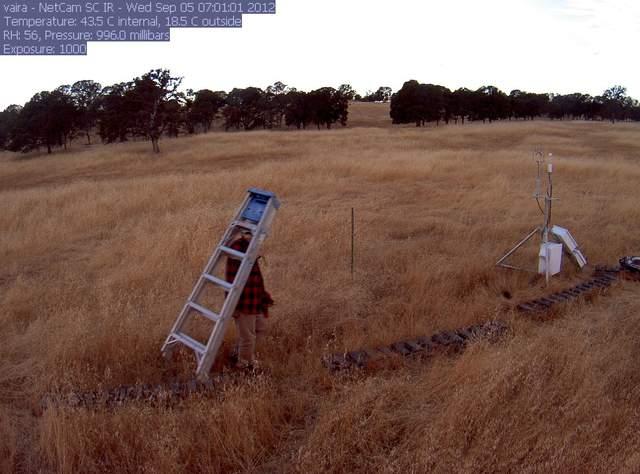
vaira_2012_09_05_070103.jpg ( 2012-09-05 06:56:24 ) Full size: 1296x960
Joe on site
9 sets found
16 VR_met graphs found
2 VR_flux graphs found
6 VR_soilco2 graphs found
No data found for VR_pond.
Can't check TZVR_mixed
No data found for VR_fd.
No data found for VR_processed.
No data found for VR_arable.
No data found for VR_soilvue.

