
Field Notes
<--2011-02-03 12:15:00 | 2011-03-08 11:00:00-->Other sites visited today: Vaira
Phenocam link: Searching...
Tonzi: 2011-02-22 00:00:00 (DOY 53)
Author: Siyan Ma
Others:
Summary: Tower batteries need to be replaced because no nighttime data.
| Feb. 22, 2011
It’s a beautiful sunny day. Grasses looked still weak. No tree leaf yet. See cows at Vaira. Tonzi – Tower: Everything worked well. Downloaded data, but met data are only available during the daytime in many cloudy/rainy days. Thus, replace batteries is high considerable. Power status: 13.4, 0.0, 2.5. CO2 profile system still offline. Tonzi – Floor: Everything worked well. Downloaded data. Power status: 14.1, 14.3, 1.9. Other data collection: Soil moisture: input. Groundwater: floor=20.4ft; tower=24.0ft; roadside=21.0ft. The sensor did not perform well. Dendromenter: input. Spectrum at Vaira: Since Young have proved that direct upward camera can capture better imagine to estimate tree leaf development, I think we should not use cosine filter on the spectralmeter either. The idea of cosine filter is similar to that of fisheye lens – correct various light directions to vertical light. However, the scope of the spectralmeter is much smaller than a digital camera. Soil Moisture 2/22/2011, Day 53 tonzi, 7931AFE, 402165, 574B4B, 402FF3, 574632, 7A432E, 7A3C6E, 7A3B40, 7A4AAA 0-15, 39.9, 29.0, 39.9, 34.2, 39.9, 30.6, 30.1, 29.1, 28.5 15-30, 42.3, 43.9, 50.0, 39.3, 41.4, 40.5, 31.8, 34.0, 30.3 30-45, 46.3, 47.2, 39.6, 42.4, 49.6, 36.2, 32.3, 34.4, 37.7 45-60, 41.0, 57.2, 58.2, 44.6, 39.6, 37.3, 43.4, 47.7, 41.6 A6D882B, A3D04E8, A6D72F5 0-15, 30.7, 22.6, 30.7 15-30, 31.2, 25.7, 36.8 30-45, 36.7, 43.3, 45.8 45-60, 44.7, 47.9, 43.7 vaira, 57318a, 7933dee, 00000128B97F3, 00000128B8072, 00000128BDDE8 0-15, broken, 31.0, 28.5, 4.1, 4.3 15-30, broken, 33.1, 31.1, 9.2, 10.8 30-45, broken, 32.6, 10.7666667, 22.9, 30.233333 45-60, broken, 42.3, 31.6, 19.2333333, 33.3 |
Field Data
No tank data
Well Depth
| Date | Location | Depth (feet) |
|---|---|---|
| 2011-02-22 | TZ_floor | 20.4 |
| 2011-02-22 | TZ_road | 21 |
| 2011-02-22 | TZ_tower | 24 |
No TZ Moisture Point data found
No VR Moisture Point data found
No TZ grass heigth found
No VR grass heigth found
No TZ Tree DBH found
No water potential data found
No TZ Grass Biomass data found
No TZ OakLeaves Biomass data found
No TZ PineNeedles Biomass data found
6 photos found
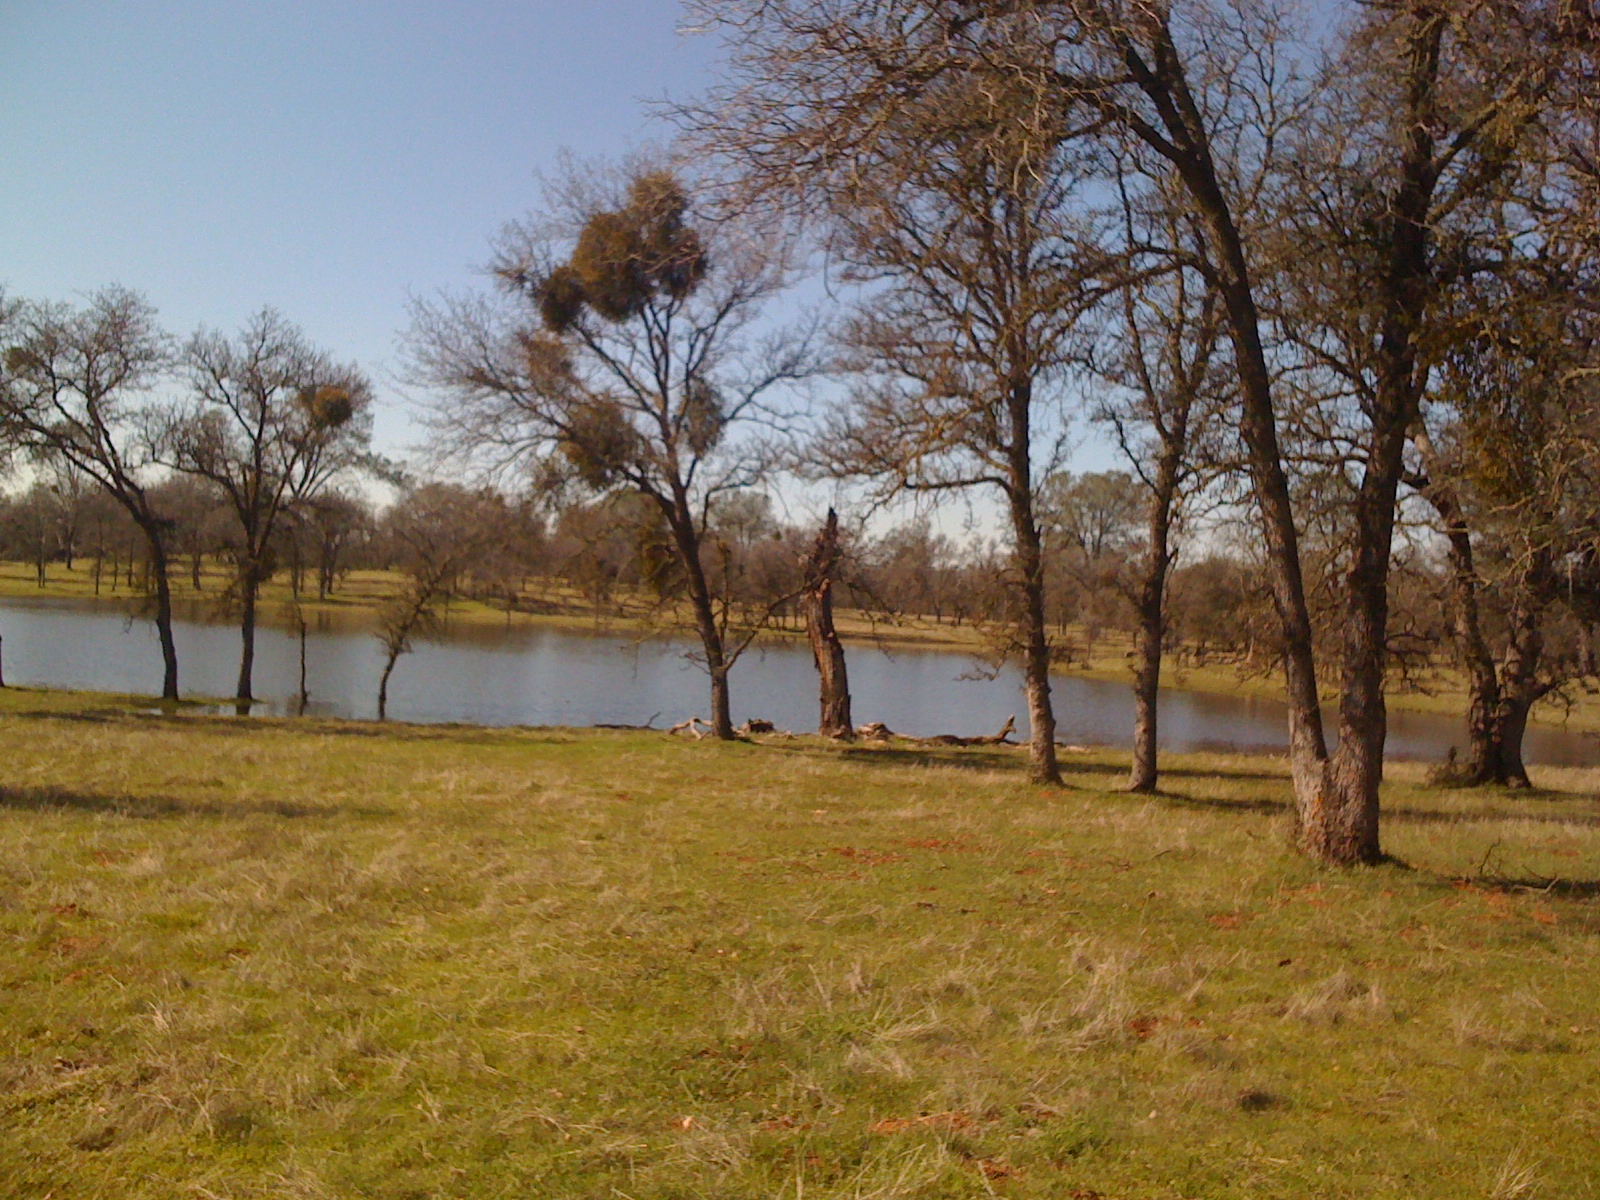
tz_IMG_7547.jpg ( 2011-02-22 13:28:56 ) Full size: 1600x1200
Oak trees near Tonzi pond
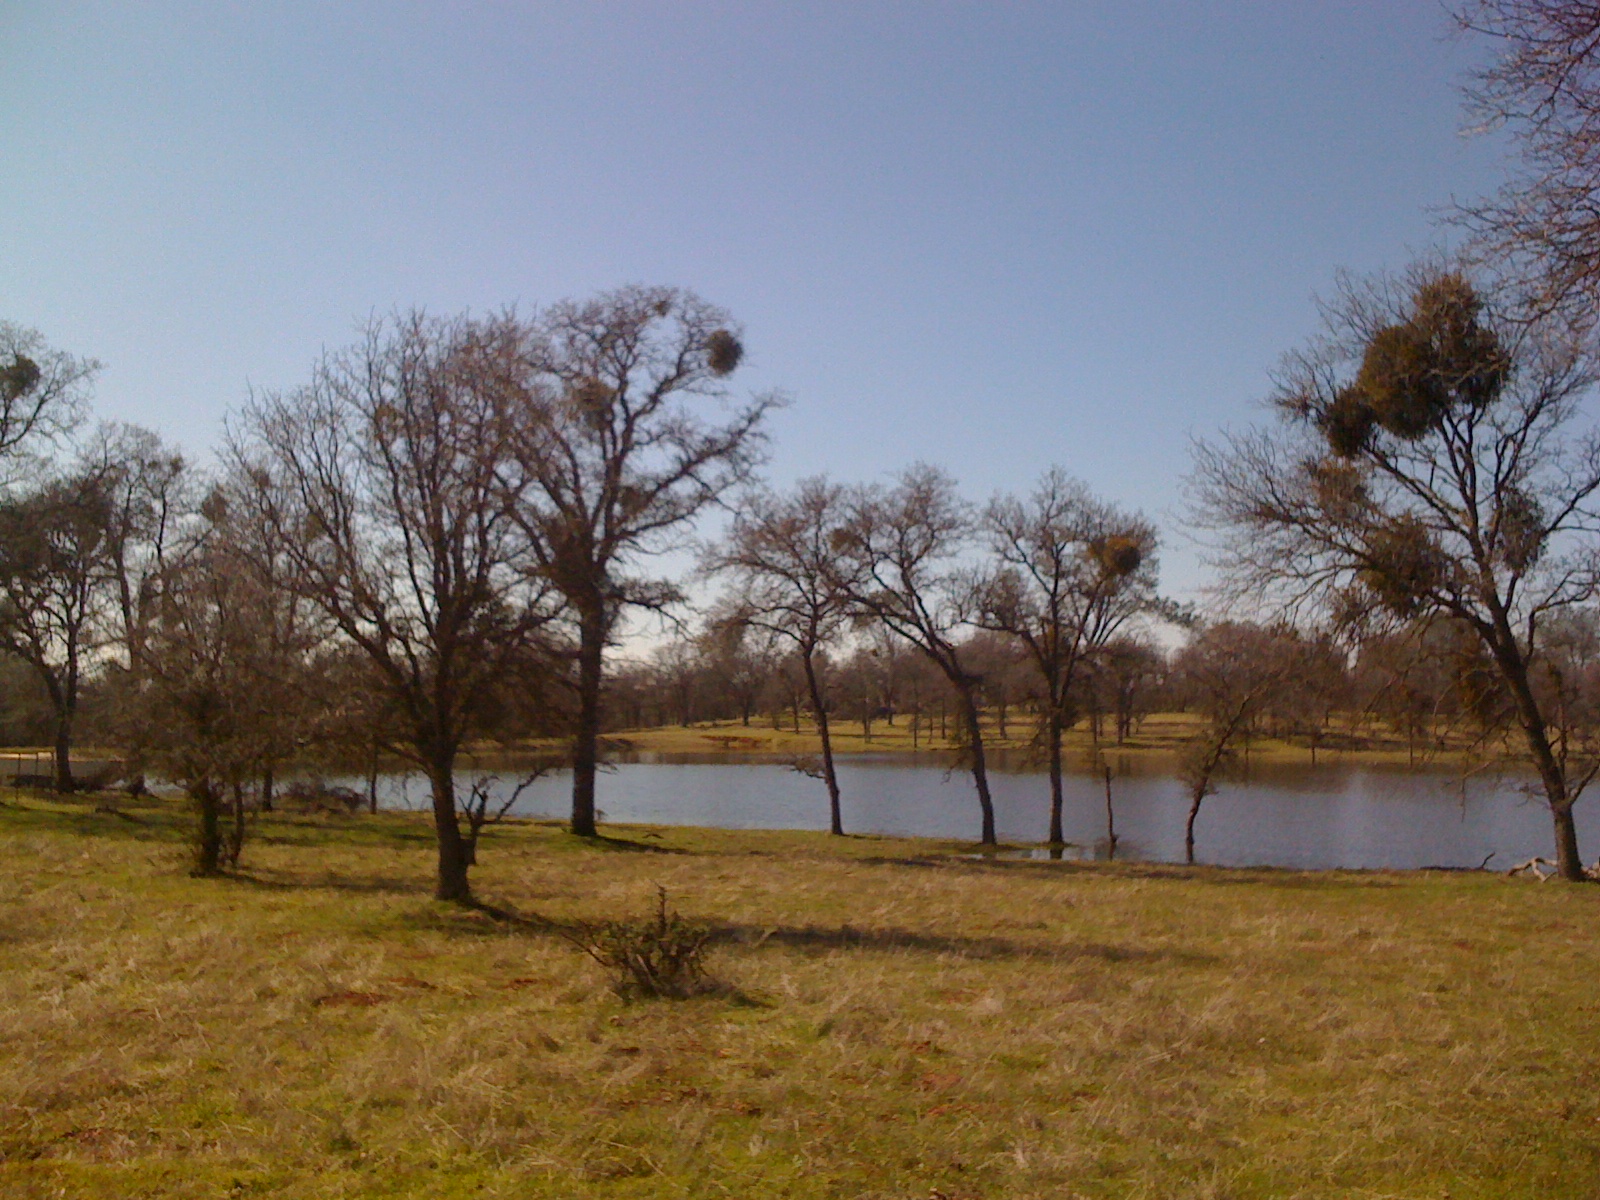
tz_IMG_7548.jpg ( 2011-02-22 13:29:03 ) Full size: 1600x1200
Tonzi pond mostly full
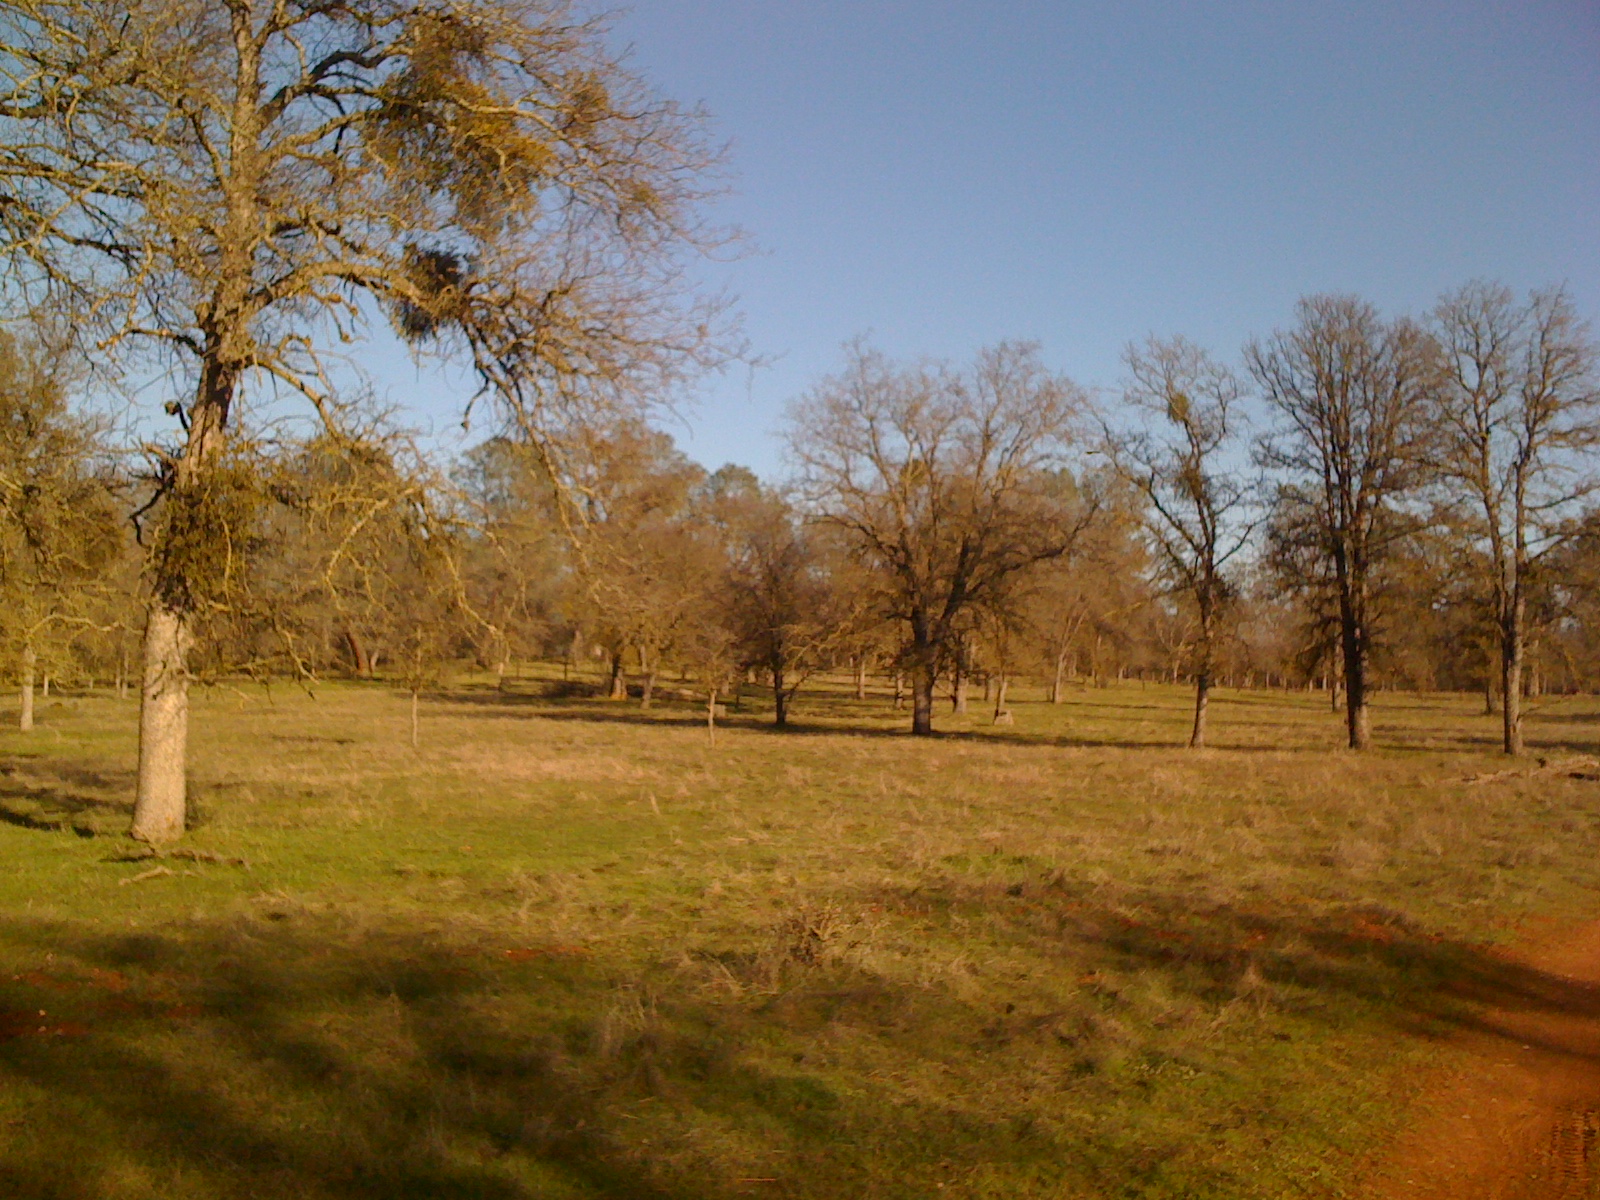
tz_IMG_7549.jpg ( 2011-02-22 16:08:55 ) Full size: 1600x1200
Evening on the oak savanna
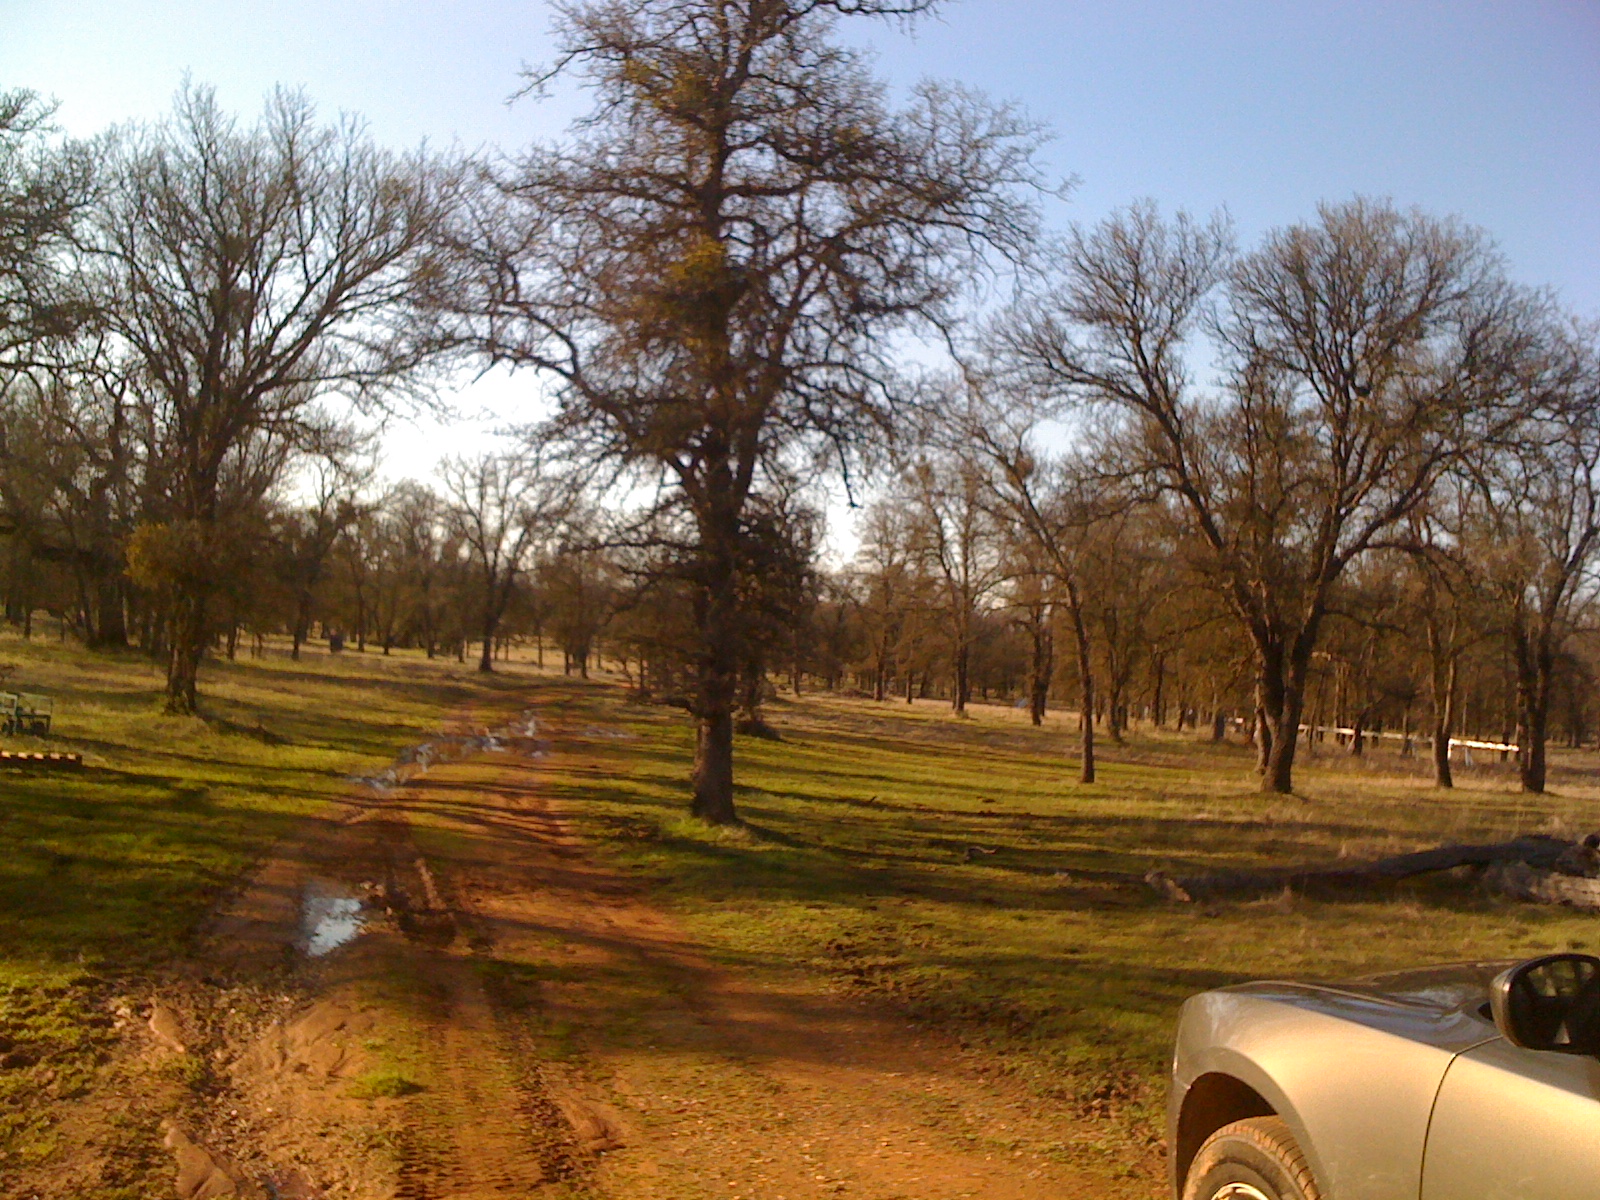
tz_IMG_7550.jpg ( 2011-02-22 16:09:08 ) Full size: 1600x1200
Muddy road at the oak savanna
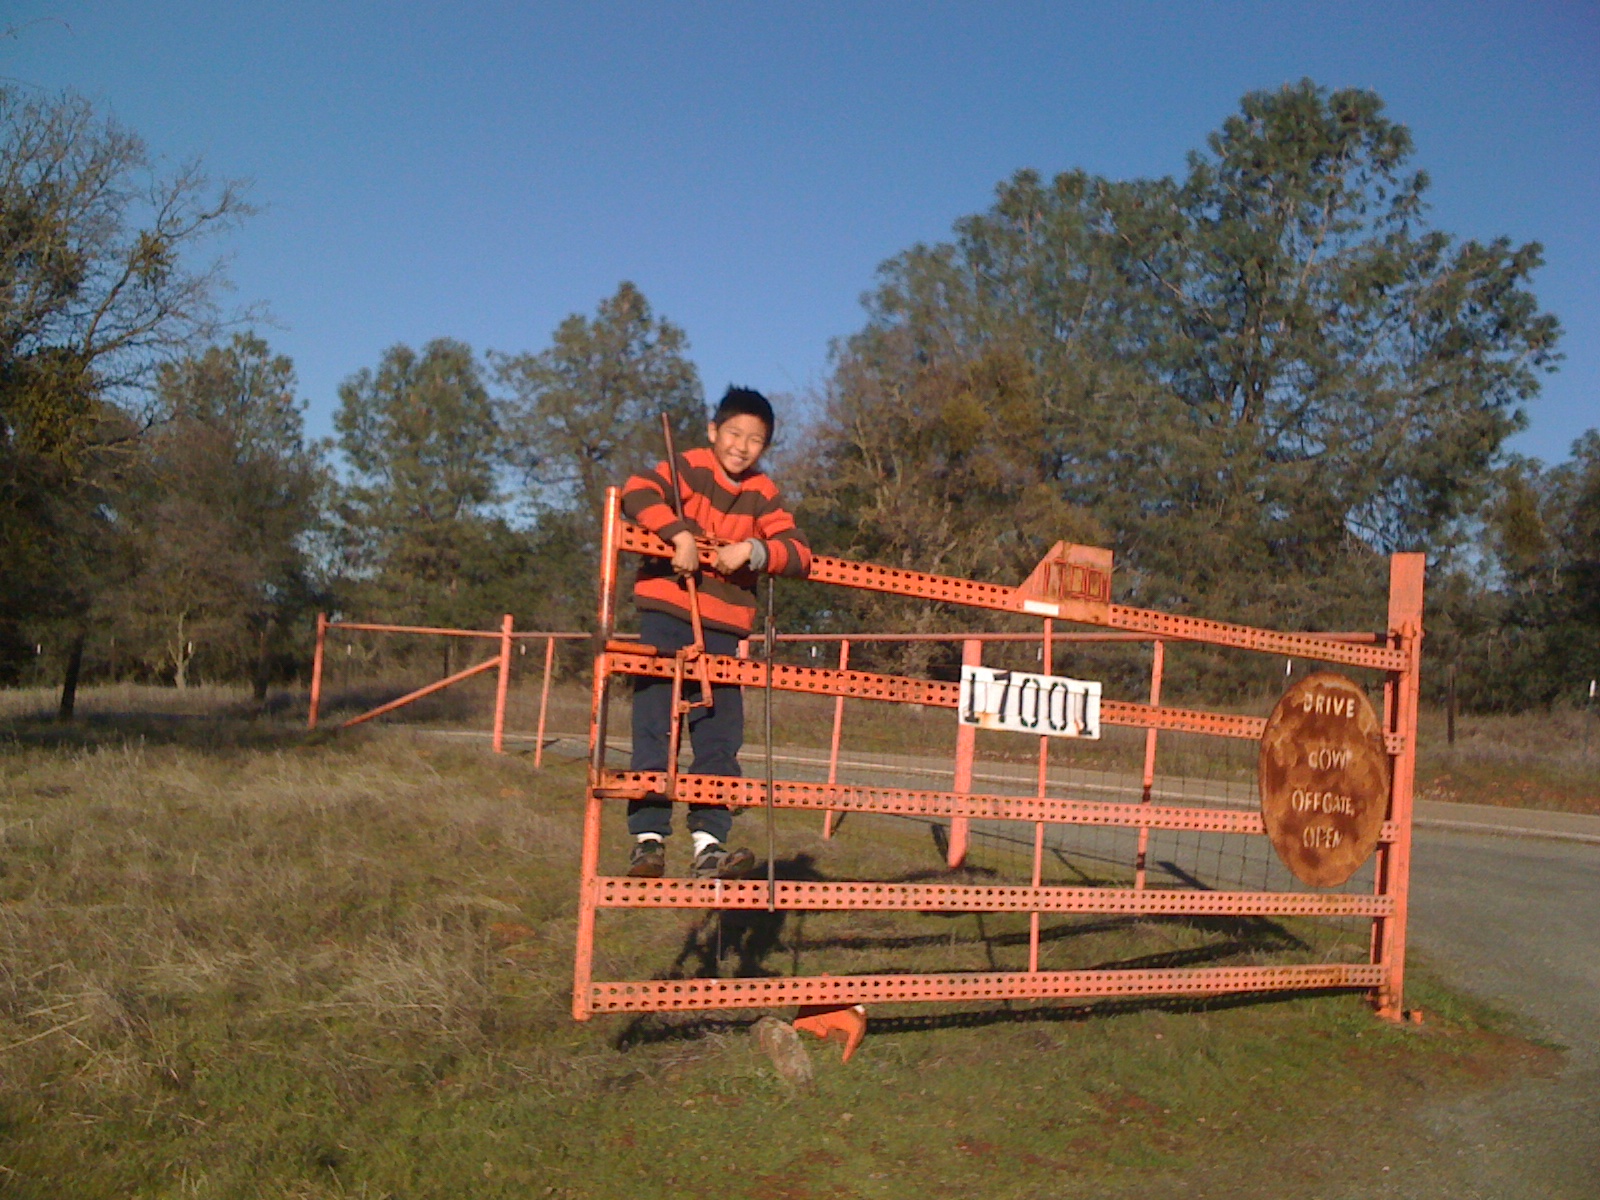
tz_IMG_7553.jpg ( 2011-02-22 16:14:39 ) Full size: 1600x1200
Sunny on the Tonzi gate
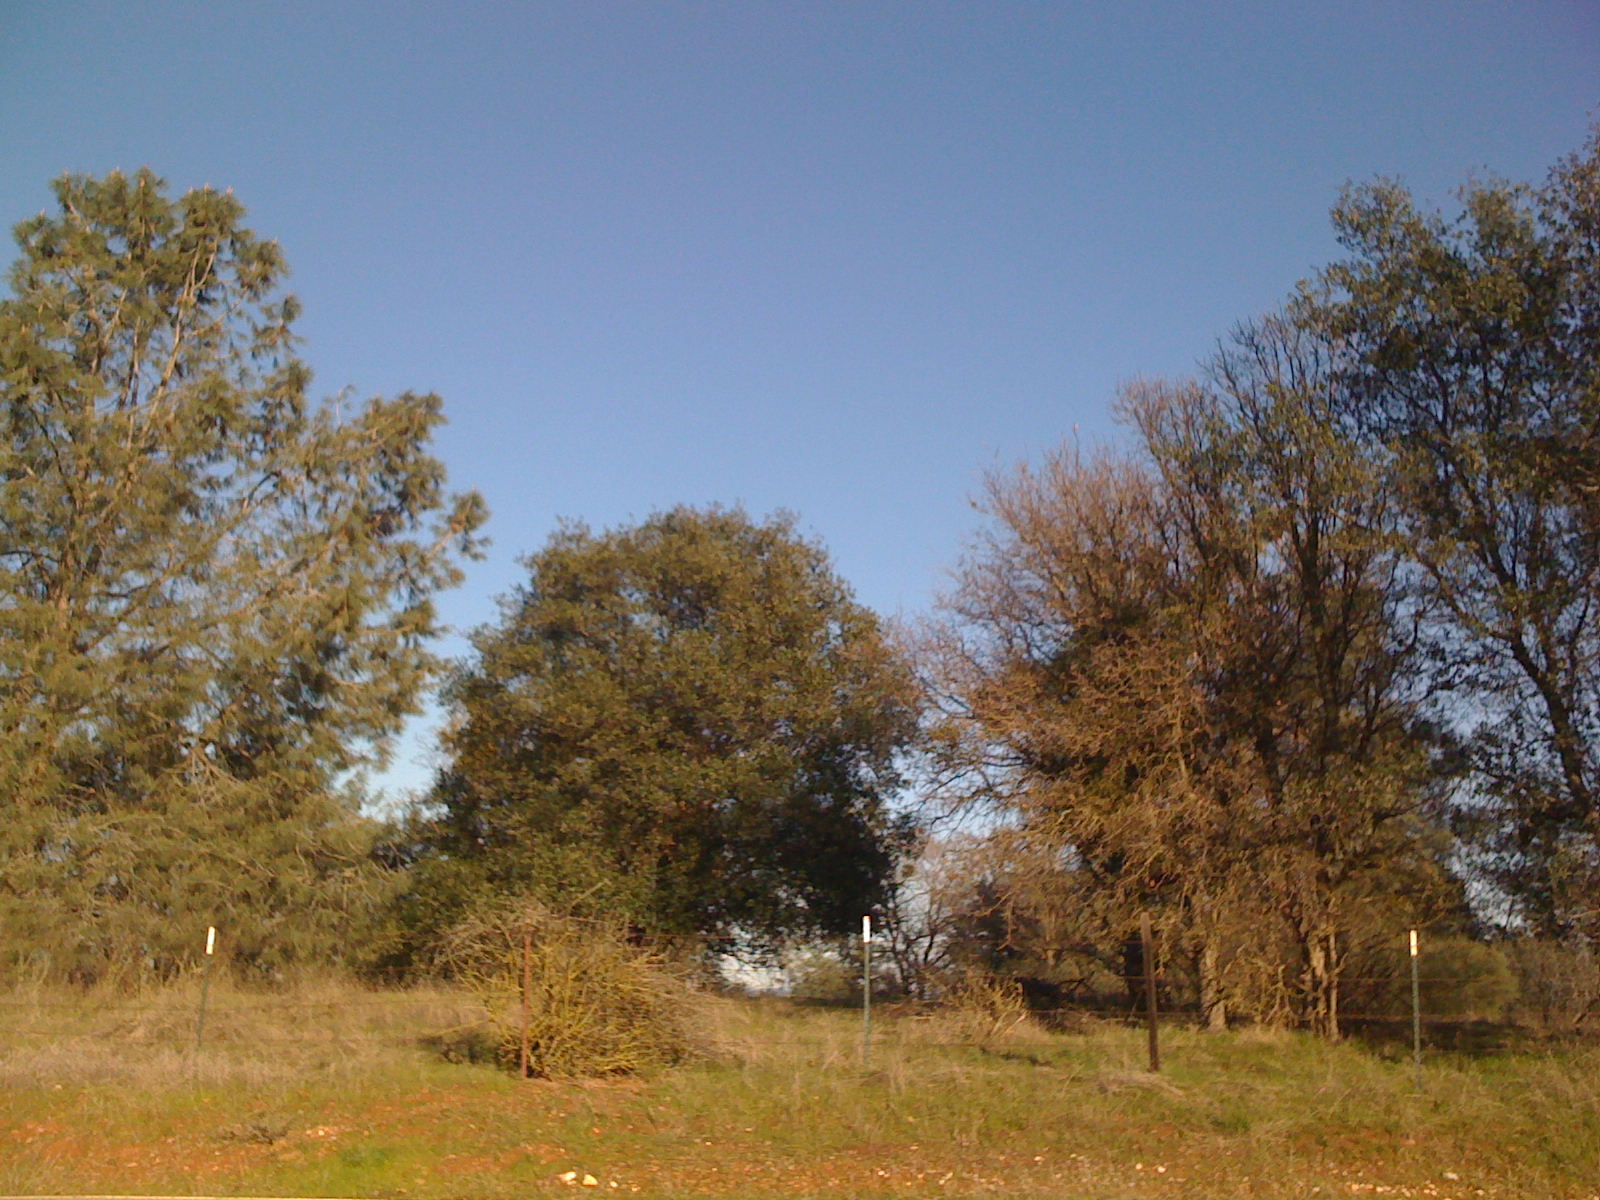
tz_IMG_7554.jpg ( 2011-02-22 16:15:13 ) Full size: 1600x1200
Trees near Irish Hill Road
16 sets found
No data found for TZ_Fenergy.
11 TZ_tmet graphs found
11 TZ_soilco2 graphs found
Can't check TZ_mixed
3 TZ_mixed graphs found
1 TZ_fflux graphs found
8 TZ_fmet graphs found
1 TZ_tram graphs found
3 TZ_co2prof graphs found
No data found for TZ_irt.
No data found for TZ_windprof.
1 TZ_tflux graphs found
2 TZ_sm graphs found
Can't check TZ_met
1 TZ_met graphs found
Can't check TZVR_mixed
No data found for TZ_osu.
No data found for TZ_fd.
Tonzi Z-cam data