Field Notes
<--2011-01-05 10:09:00 | 2011-01-28 12:00:00-->Other sites visited today: Mayberry | Twitchell Rice
Phenocam link: Searching...
Sherman Island: 2011-01-18 10:00:00 (DOY 18)
Author: Joe Verfaillie
Others: Jaclyn
Summary: LI7500 down since last visit, pulled four Decagon soil moisture probes.
| Sherman
1/18/2011 I arrived about 10am with Jaclyn. There was patchy fog that was lifting quickly with almost no wind. The field is wet and the cows have mowed it. When we approached all the cows came to see if we might feed them. No evidence that Walt has fed the cows anywhere near our tower. All the data loggers were running since Dennis’s visit on the 5th. The LI7500 SDM stream seems to have hung up. I saw this in the data collected last time just before the CR1000 cards were swapped. Restarting the CR1000 fixed the problem. I pulled out four of the Decagon soil moisture probes labeled A, B, C, and D. Maybe only one or two of the remaining one seem to be working. I’ll pull the rest and the data logger as I can. I cleaned the radiometers – just some dew. The PRT temperature from the CNR1 looks bad. |
2 photos found

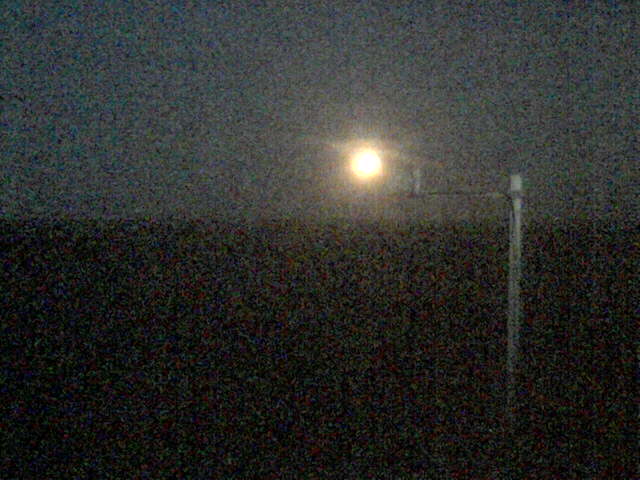
SI_webcam_2011019_0645.jpg ( 2011-01-19 06:45:02 ) Full size: 640x480
Full moon.

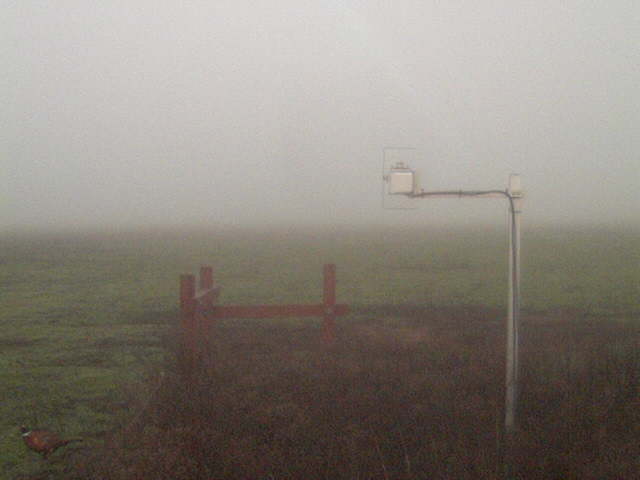
SI_webcam_2011019_0715.jpg ( 2011-01-19 07:15:02 ) Full size: 640x480
Pheasant on the ground.
7 sets found
No data found for SI_mp.
11 SI_met graphs found
Can't check SI_mixed
2 SI_mixed graphs found
5 SI_flx graphs found
2 SI_soilco2 graphs found
Can't check TWSI_mixed
Can't check SIMBTWEE_met

