Field Notes
<--2024-09-25 09:10:00 | 2024-10-23 11:35:00-->Other sites visited today: East End
Phenocam link: Searching...
Mayberry: 2024-10-11 09:45:00 (DOY 285)
Author: Daphne Szutu
Others: Arman
Summary: Sampled porewater sippers, installed new miniDOT on floating boom, dirty radiometers, measured camera height
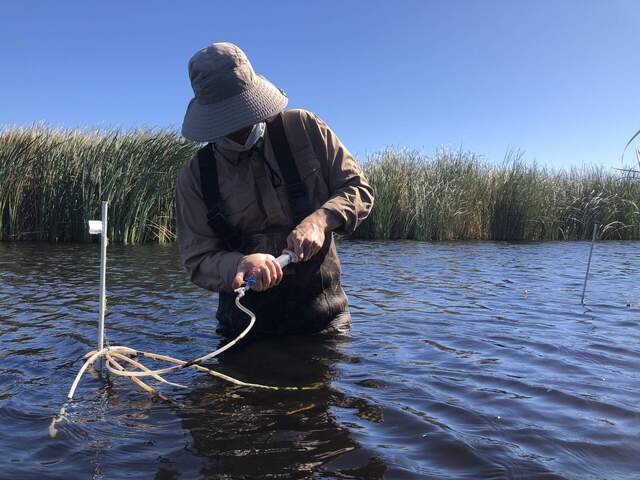
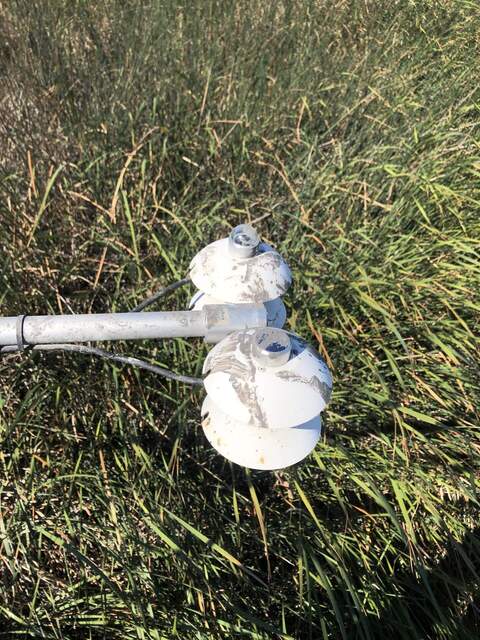
| 2024-10-11 Mayberry Arman and I arrived at 9:45 PST. It was mild and windy with scattered thin clouds. The staff gauge read 63cm. We started with sampling the porewater sippers in the channel. The water got to rib-height on the way to the sippers, but we were able to stand comfortably in waist-deep water at the sippers. A few of the sippers took effort to sample, but we were able to measure all of them. Almost all of the channel (open water) sippers had a lot of bubbles come up in the tubing. I started the tower work around 11:05 PST while Arman worked on the vegetated sippers. All of the vegetated-black sippers produced water. Only one vegetated-red sipper produced sample, and none from the vegetated-blue profile. If today’s data look ok we can probably pull the sippers next time. I downloaded met, cam, and USB GHG data. The camera was a bit tilted again so I tightened the bolt attaching it to the conduit hanger. However, I think I actually need to tighten/improve the screw attaching conduit hanger to the wooden 4x4. I changed the water level desiccant. I accidentally dropped one of the desiccant minipaks in the water. The picam is 529cm agl – might be important in angle of view. I removed the scrap 4x4 and limb saw that we left on the upper boardwalk during the last site visit. I installed a brand-new miniDOT sn 387260 on the floating boom. It was shipped with lithium batteries and a desiccant minipak. I checked its clock using miniDOTControl.jar and it said time error = 0, which was unexpectedly accurate. I’ll check it again next time I download. I changed its sampling interval to 1 minutes to match our other miniDOTs. I cleaned flux and rad sensors and topped off the wash reservoir. The SWin, LWin, and PARin were all muddy. I looked at the phenocam photos back in the lab and saw a great blue heron hanging out some evenings on top of the radiometers. Arman finished attempting the vegetated sippers. He dropped one of the 2-way valves and a piece of soft tubing into the water after the very last sipper. We did not recover it. I checked that the precip bucket was clean. The 7500 read: 427ppm CO2, 647mmol/m3 H2O, 21.0C, 101.0kPa, 103SS—107 after cleaning The 7700 read: 2.1ppm CH4, 43RSSI – 72 after cleaning Sipper, temperature-compensated conductivity, temperature, notes Open-blue-yellow, 3248uS, 19.1C, lots of bubbles and only residue from the yellow tape remains Open-blue-red, 5.71mS, 18.7C, some bubbles and Veg-blue-black sipper started emitting bubbles while sampling this sipper Open-blue-white, 6.63mS, 18.8C, some bubbles and rinse water (10ml) was clear but sample water (20+ml) was turbid Open-blue-black, 5.92mS, 18.9C, some bubbles Surface, 1243uS, 18.9C Open-blue-green, 4760uS, 19.1C, some bubbles Open-red-yellow,,, very hard to pull and accidentally spilled sample when pulling out plunger Open-red-red, 7.10mS, 19.8C, some bubbles Open-red-white, 6.44mS, 20.4C, also hard to pull and some bubbles Open-red-black, 6.85mS, 20.2C, second sample because forgot to use compensated mode the first time and some bubbles Open-red-green, 6.82mS, 19.5C, second sample because forgot to use compensated mode the first time and some bubbles Open-black-yellow, 6.02mS, 20.8C, manually calculated temperature-compensated conductivity with raw values of 5.51mS at 20.8C and some bubbles Open-black-green, 6.79mS, 20.5C, some bubbles Open-black-white, 6.51mS, 20.0C, second sample because forgot to use compensated mode the first time and some bubbles Open-black-black, 7.04mS, 20.6C, second sample because forgot to use compensated mode the first time and some bubbles Open-black-red, 7.21mS, 20.1C, second sample because forgot to use compensated mode the first time and some bubbles Surface, 1220uS, 19.2C Veg-black-yellow, 1.330mS, 10C ,did not record temperature but confirmed probe was in temperature-compensated mode Veg-black-red, 1.275mS, 10C ,did not record temperature but confirmed probe was in temperature-compensated mode Veg-black-white, 1.701mS, 10C ,did not record temperature but confirmed probe was in temperature-compensated mode Veg-black-black, 1.275mS, 10C ,did not record temperature but confirmed probe was in temperature-compensated mode Veg-black-green, 1.266mS, 10C ,did not record temperature but confirmed probe was in temperature-compensated mode Veg-red-black, 4.55mS, 10C ,did not record temperature but confirmed probe was in temperature-compensated mode We left at 11:50 PST. |
2 photos found

20241011MB_ArmanSipper.jpg ( 2024-10-11 11:34:58 ) Full size: 1920x1440
Arman sampling one of the open water porewater sippers

20241011MB_DirtyRadiometer.jpg ( 2024-10-11 12:19:28 ) Full size: 1440x1920
Muddy radiometers from dirty bird feet
11 sets found
7 MB_flux graphs found
No data found for MB_met.
28 MB_tule graphs found
Can't check MBWPEESWGT_mixed
1 MB_cam graphs found
Can't check MBEEWPSWEPGT_cam
Can't check SIMBTWEE_met
No data found for MB_minidot.
Can't check MBSWEEWPBCBA
1 MB_processed graphs found
Can't check MB_fd
1 MB_fd graphs found

