Field Notes
<--2024-09-27 09:40:00 | 2024-10-29 10:30:00-->Other sites visited today: Vaira | Gilbert Tract | Hill Slough
Phenocam link: Searching...
Tonzi: 2024-10-10 10:00:00 (DOY 284)
Author: Joe Verfaillie
Others: Kuno, Ana Maria
Summary: Ana Maria visiting from Kim Novick's lab, adding 7700s to both towers, Stem/soil chambers, midday water potential, Remove lowest CO2 sensor from Tower
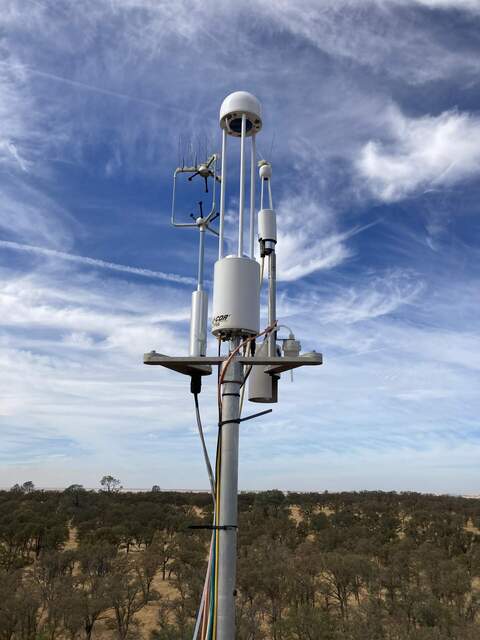
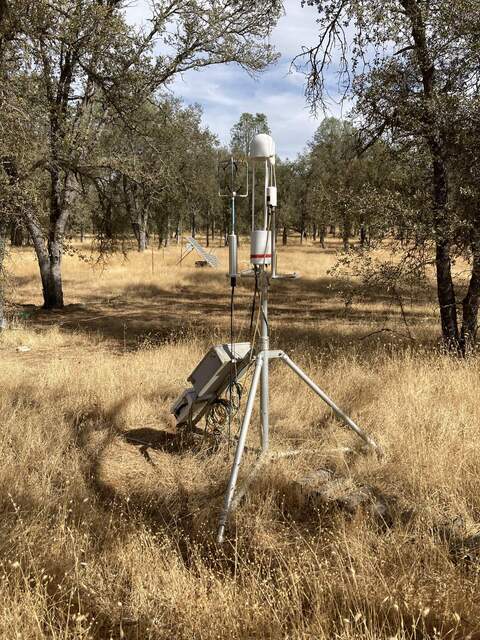
| Tonzi 2024-10-10 Kuno and I arrived at about 11:00 PDT. Ana Maria from Kim Novick's lab met us at the gate. She has recently moved to Mountain View and is interested in making all sorts of water potential and related measurements at Tonzi. We also met Rob on the way in. He said he took a tumble down a slope recently while repairing fences and banged his leg up. Luckily his son was with him or he would still be laying there. It was mild with high thin clouds but the ground is still dry and dusty. The trees are definitely brown and loosing leaves. The pond is a puddle. I worked on adding LI-7700 CH4 sensors to the towers. L-brackets with rail fitting mounts went on easily with existing bolts not being frozen in place. The Tower top 7700 sn TG1-0421 has a cruddy Ethernet cable that has a nick in it near the railing and I almost couldn't get the connector to screw in to the bottom of the 7550 box. The wash box tubing was also short and the wash box is mounted at an angle on a diagonal strut. But it was running and completed a manual spray wash cycle. I got about three hours of data from the new system before we left. The power cable and wash tubing are from Rush Ranch. Next time I need to think about a better mount for the wash box and maybe swap the Ethernet cable and spray tubing and head. The 7500 read: 421.9ppm CO2, 530.2mmol/m3 H2O, 26.1C, 99.1kPa, 100.0SS The 7700 read: 2.02ppm CH4, 83.1RSSI At the Floor site 7700 sn TG1-0514 was installed. This one and its power cable belongs to Rush Ranch - the Ethernet cable is ours. There is no wash box for this analyzer. It too was connected to the 7550 and seemed to be logging data but I did not collect any here. The 7500 read: 429.0ppm CO2, 511.8mmol/m3 H2O, 29.7C, 99.0kPa, 97.3SS The 7700 read: 2.01ppm CH4, 79.2RSSI I collected flux and camera data from the Tower top. Flux and well data from the Floor. Read the dendrometers, measurement the wells, collected the FD data and serviced the z-cams. I did not have time to do the manual soil moisture readings but I doubt they have changed much from last time. Ana Maria and I did leaf water potential together. She seems to think our methods were just fine and agreed that there are a lot of nitpicky methodologies out there that don't seem to make a lot of difference. We tried a pine twig. The pine twig was oozing sap almost as soon as it was cut and only got up to about -8bars before it was blowing bubbles. The oaks were still at about -40bar. Kuno did the full round of stem and soil collars. He said the trees were mostly emitting CH4. Ana Maria talked to him about stem temperatures and estimating sap flow. We also need to think about getting water samples from the wells to run the head space through the analyzer. The lowest GMP343 had a bad CO2 reading again and a restart didn't fix it. I removed this sensor sn N2220007 to test in the lab. We left at about 15:30 PDT |
Field Data
No tank data
Well Depth
| Date | Location | Depth (feet) |
|---|---|---|
| 2024-10-10 | TZ_floor | 28.15 |
| 2024-10-10 | TZ_road | 36.8 |
| 2024-10-10 | TZ_tower | 32.8 |
| 2024-10-10 | VR_well | 59 |
| 2024-10-10 | GT | 1.64 |
| 2024-10-10 | HS | 4.7 |
No TZ Moisture Point data found
No VR Moisture Point data found
No TZ grass heigth found
No VR grass heigth found
Tree DBH
| Date | Tag# | Reading (mm) |
|---|---|---|
| 2024-10-10 | 1 | 7.9 |
| 2024-10-10 | 102 | 3.9 |
| 2024-10-10 | 2 | 17.1 |
| 2024-10-10 | 245 | 10.8 |
| 2024-10-10 | 3 | 9.2 |
| 2024-10-10 | 4 | 11.5 |
| 2024-10-10 | 5 | 21.1 |
| 2024-10-10 | 6 | 8.9 |
| 2024-10-10 | 7 | 16.7 |
| 2024-10-10 | 72 | 10.0 |
| 2024-10-10 | 79 | 10.8 |
Water Potential - mode: raw
| Time | Species | Tree | readings (bar) | ||
|---|---|---|---|---|---|
| 2024-10-10 12:13:00 | OAK | 102 | -42 | -44 | -35 |
| 2024-10-10 12:13:00 | OAK | 92 | -40 | -46 | |
No TZ Grass Biomass data found
No TZ OakLeaves Biomass data found
No TZ PineNeedles Biomass data found
2 photos found

20241010TZ_TowerTopMethane.jpg ( 2024-10-10 12:45:23 ) Full size: 1440x1920
LI-7700 installed on the Tonzi Tower top

20241010TZ_FloorMethane.jpg ( 2024-10-10 14:31:45 ) Full size: 1440x1920
LI-7700 added to the Floor tower
16 sets found
No data found for TZ_Fenergy.
11 TZ_tmet graphs found
No data found for TZ_soilco2.
Can't check TZ_mixed
3 TZ_mixed graphs found
1 TZ_fflux graphs found
8 TZ_fmet graphs found
No data found for TZ_tram.
3 TZ_co2prof graphs found
1 TZ_irt graphs found
No data found for TZ_windprof.
1 TZ_tflux graphs found
8 TZ_sm graphs found
Can't check TZ_met
1 TZ_met graphs found
Can't check TZVR_mixed
8 TZ_osu graphs found
3 TZ_fd graphs found
Tonzi Z-cam data

