Field Notes

<--2010-12-30 08:00:00 | 2011-01-19 00:00:00-->
Other sites visited today: Twitchell Rice | Mayberry | Sherman Island
Phenocam link: Searching...

Tonzi: 2011-01-05 08:00:00 (DOY 5)
Author: Siyan Ma
Others:

Summary: Installed new computer at Floor site, swapped Floor and Tower LI-7500.

Clear day, nice breeze, a lot of standing water on the ground.
Very foggy around the Delta area.
See cows at Vaira; grasses looked not that strong.

1. Put a new set of computer back to the Floor sites. Flux worked well. Computer successfully communicated with each datalogger.
2. Downloaded data at Vaira, Floor, and Tower.
3. Swapped Li7500 at Floor and Tower sites:
• Floor: remove #041, install 035;
• Tower: remove #065, install #0976.
4. Downloaded data from the ground water sensor. It worked well.
5. Readings of the power regulator at each site:
• Vaira: 13.3, 20.9, 3.3;
• Tower: 13.2, 0.0, 2.6;
• Floor: 13.1, 14.3, 2.1.
6. Fixed the broken fence around the Floor site.
7. Cleaned up the surface of radiation sensors.
8. Cleaned up bird craps on the cover of rain gage at the Tower.
9. CO2 profile system remained no-run.
10. Collected grass samples at Vaira and Tonzi.

Field Data

No tank data

No TZ Well data found

No TZ Moisture Point data found

No VR Moisture Point data found

No TZ grass heigth found

No VR grass heigth found

No TZ Tree DBH found

No water potential data found

No TZ Grass Biomass data found

No TZ OakLeaves Biomass data found

No TZ PineNeedles Biomass data found

10 photos found
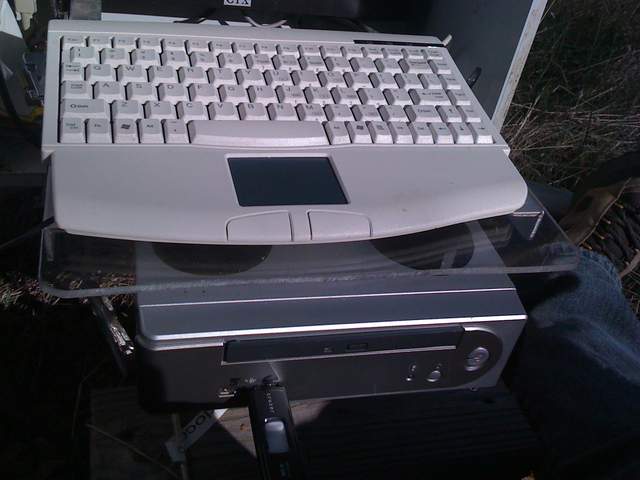
Floor site computer and keyboard
tz_IMG_7443.jpg ( 2011-01-05 13:12:05 ) Full size: 1600x1200
Floor site computer and keyboard
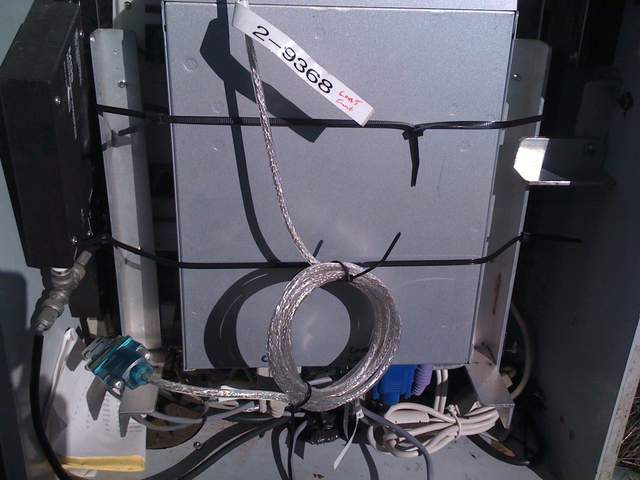
Serial port adapter on computer
tz_IMG_7444.jpg ( 2011-01-05 13:12:56 ) Full size: 1600x1200
Serial port adapter on computer
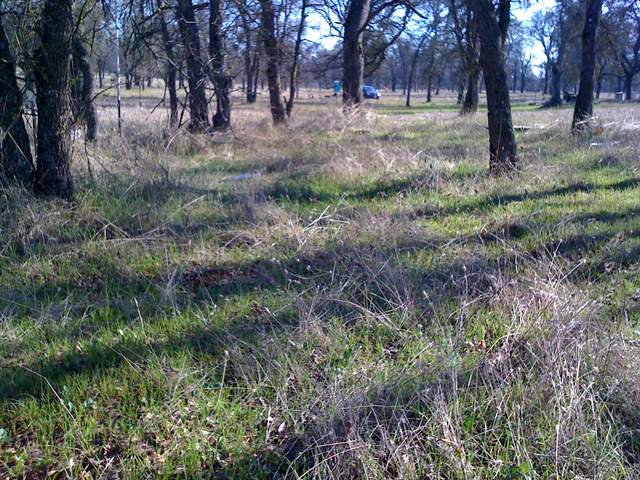
New grass and tree trunks
tz_IMG_7445.jpg ( 2011-01-05 13:13:25 ) Full size: 1600x1200
New grass and tree trunks
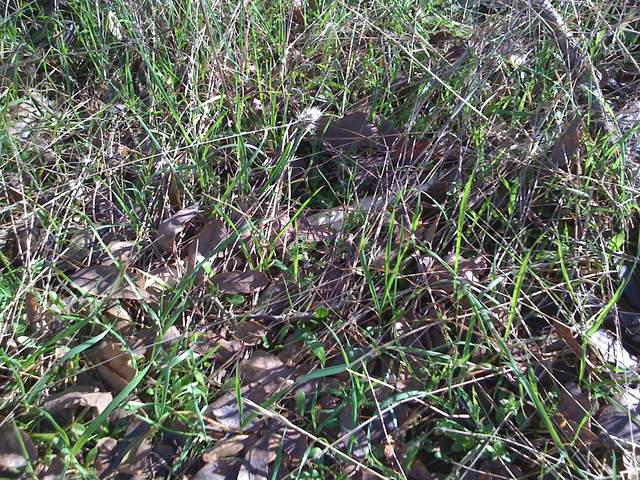
Close up of new grass at Tonzi
tz_IMG_7446.jpg ( 2011-01-05 13:13:31 ) Full size: 1600x1200
Close up of new grass at Tonzi
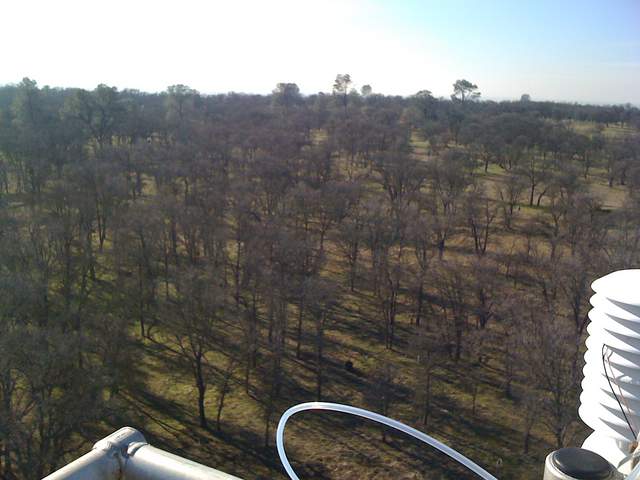
View of leafless oaks from the tower top
tz_IMG_7447.jpg ( 2011-01-05 13:41:33 ) Full size: 1600x1200
View of leafless oaks from the tower top
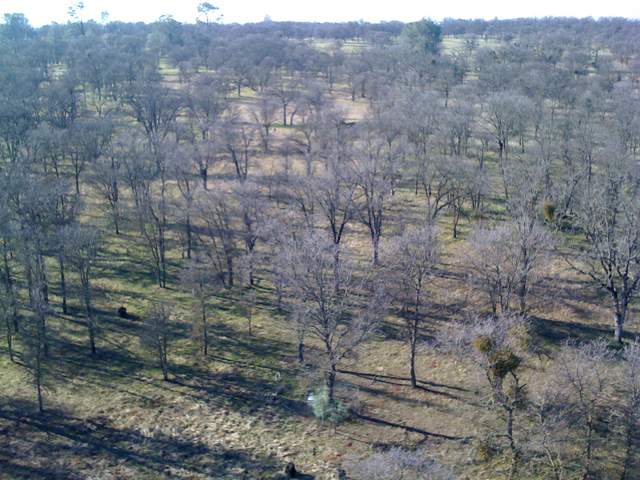
View of leafless oaks and new grass from the tower top
tz_IMG_7448.jpg ( 2011-01-05 13:41:39 ) Full size: 1600x1200
View of leafless oaks and new grass from the tower top
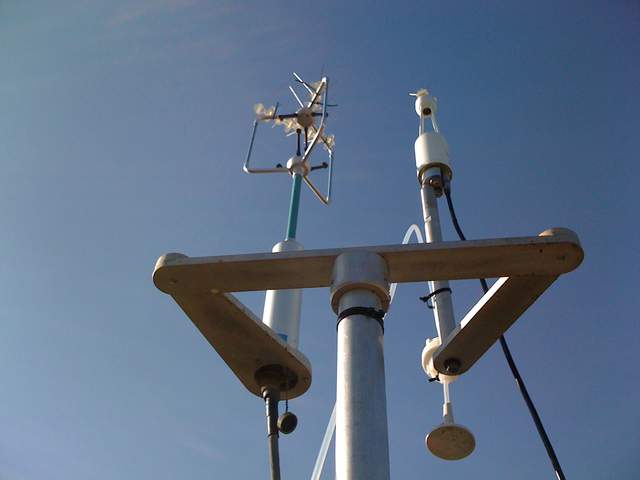
Eddy sensors on the tower top
tz_IMG_7449.jpg ( 2011-01-05 13:41:46 ) Full size: 1600x1200
Eddy sensors on the tower top
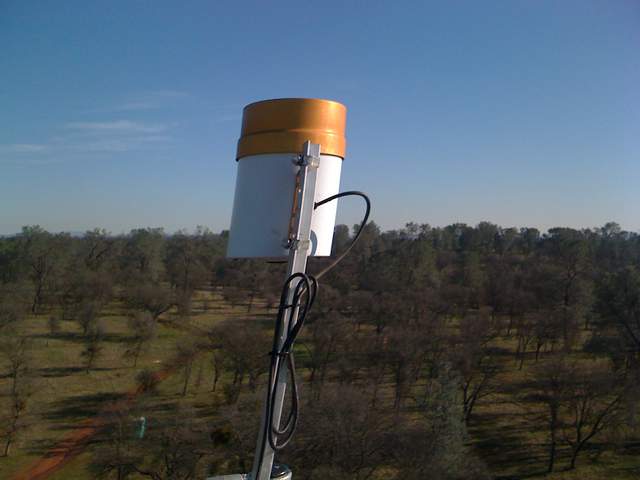
Tipping rain bucket on the tower top
tz_IMG_7450.jpg ( 2011-01-05 13:41:50 ) Full size: 1600x1200
Tipping rain bucket on the tower top
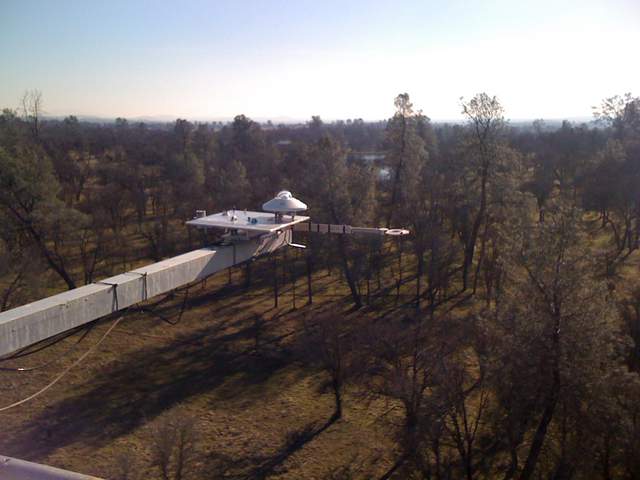
Radiometers on the tower top
tz_IMG_7451.jpg ( 2011-01-05 13:41:55 ) Full size: 1600x1200
Radiometers on the tower top
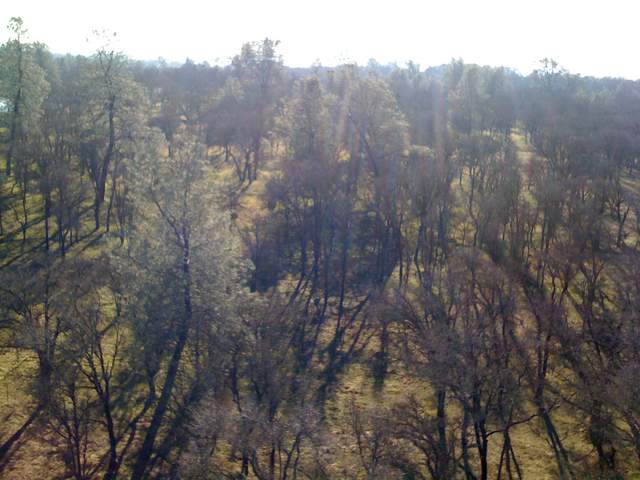
View of oaks and pine from the tower
tz_IMG_7452.jpg ( 2011-01-05 13:42:05 ) Full size: 1600x1200
View of oaks and pine from the tower

Graphs display:
16 sets found

3 TZ_Fenergy graphs found

Explore the graph:Floor Net Radiation and Soil Heat Flux in a new window

Explore the graph:Floor PAR in a new window

Explore the graph:Floor Air Temperature and RH in a new window

11 TZ_tmet graphs found

Explore the graph:Tonzi Tower Met: Temperature and Power in a new window

Explore the graph:Tonzi Tower Met: Solar Radiation in a new window

Explore the graph:Tonzi Tower Met: IRT Sensors in a new window

Explore the graph:LED Sensor Incoming in a new window

Explore the graph:LED Sensor Outgoing in a new window

Explore the graph:4-Band Solar Radiation in a new window

Explore the graph:Air Temperature Profile in a new window

Explore the graph:Relativity Humidity Profile in a new window

Explore the graph:Tonzi Tower PRI in a new window

Explore the graph:SRS PRI/NDVI in a new window

Explore the graph:SRS NDVI in a new window

11 TZ_soilco2 graphs found

Explore the graph:Tonzi Soil CO2 Profile: Open (East) CO2 in a new window

Explore the graph:Tonzi Soil CO2 Profile: Tree (West) CO2 in a new window

Explore the graph:Tonzi Soil CO2 Profile: Open (East) Temperatures in a new window

Explore the graph:Tonzi Soil CO2 Profile: Tree (West) Temperatures in a new window

Explore the graph:Tonzi Soil CO2 Profile: Upper CO2 in a new window

Explore the graph:Tonzi Soil CO2 Profile: Lower CO2 in a new window

Explore the graph:Tonzi Soil CO2 Profile: Upper Temperatures in a new window

Explore the graph:Tonzi Soil CO2 Profile: Lower Temperatures in a new window

Explore the graph:Tonzi Soil CO2 Profile: Power and Temperature in a new window

Explore the graph:Tree 2 Soil CO2 in a new window

Explore the graph:Tree 2 Soil Temperature in a new window

Can't check TZ_mixed
3 TZ_mixed graphs found

Explore the graph:Tonzi PPT in a new window

Explore the graph:Tonzi CO2 and H2O Densities in a new window

Explore the graph:Air Pressure in a new window

No data found for TZ_fflux.
8 TZ_fmet graphs found

Explore the graph:Soil Heat Flux in a new window

Explore the graph:Tonzi Soil Temperature Set A in a new window

Explore the graph:Tonzi Soil Temperatures Set B in a new window

Explore the graph:Tonzi Soil Temperatures Set C in a new window

Explore the graph:Tonzi Soil Temperature Set D in a new window

Explore the graph:Well Level in a new window

Explore the graph:Well Water Temperature in a new window

Explore the graph:Soil Water Potential in a new window

No data found for TZ_tram.
3 TZ_co2prof graphs found

Explore the graph:Tower CO2 Profile Concentrations in a new window

Explore the graph:Tower CO2 Profile Cell Pressure in a new window

Explore the graph:CO2 Profile Sensor Temperature in a new window

No data found for TZ_irt.
No data found for TZ_windprof.
1 TZ_tflux graphs found

Explore the graph:Tower CO2 and H2O in a new window

2 TZ_sm graphs found

Explore the graph:Floor Solar Radiations in a new window

Explore the graph:TZ Soil Moisture in a new window

Can't check TZ_met
1 TZ_met graphs found

Explore the graph:Floor and Tower RH in a new window

Can't check TZVR_mixed
No data found for TZ_osu.
No data found for TZ_fd.
Tonzi Z-cam data

plot of Tonzi z-cam LAI

plot of Tonzi z-cam gap fration