Field Notes
<--2024-08-29 09:04:00 | 2024-09-19 09:00:00-->Other sites visited today: East End | Bouldin Corn | Bouldin Alfalfa
Phenocam link: Searching...
Gilbert Tract: 2024-09-12 08:55:00 (DOY 256)
Author: Daphne Szutu
Others: Koong
Summary: Mild fall day, Fiddling with CR6/EXO settings to get 5-min data saved
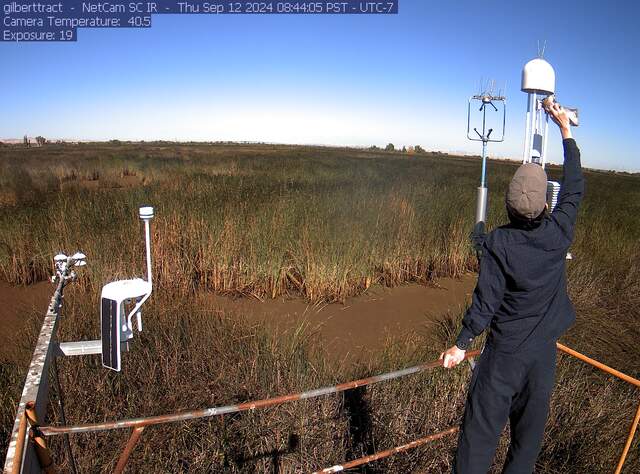
| 2024-09-12 Gilbert Tract Koong and I arrived at 8:55 PST. It was mild with a cool breeze and a warm sun. We could hear birds from the wetland and cows from the pasture. There was half of a dead crayfish on the middle boardwalk that ants were going to town on. There was also a live crayfish hiding by one of the cinder block under the tower. The staff gauge read 27cm at 9:13 PST. I downloaded met, cam, and USB GHG data. I downloaded data from the Song Meter Micro, changed its desiccant, synched its time/location with my phone, and noted that the battery was at 43%. Might need spare batteries next time. Koong cleaned flux and rad sensors, and he got sprayed by the 7700 wash because he happened to be cleaning at exactly 9:00 PST. He topped off the reservoir and left the lid open because there were some wasps. I left a prophylactic mothball in the met box. Koong measured the surface water conductivity. Surface, 528 uS, 19.6C The 7500 read 419ppm CO2, 602mmol/m3 H2O, 22.4C, 100.9kPa, 101SS - 102 after cleaning The 7700 read: 2.07ppm CH4, 42RSSI - 76 after cleaning We got to the channel around 9:30 PST. I downloaded Flo’s data, set the clock manually, and restarted logging. I downloaded the CR6 data and confirmed it only had data every 3.5 hours from 9 columns only (should be 11). We pulled the sensors out of the water and I was able to connect to the EXO with Bluetooth, even though I couldn’t last week. I thought I downloaded the 5min data from the EXO, but later I couldn’t find the file, so I’ll have to download it again next time and pay attention to where it goes. I couldn’t figure out how to see the settings of the current deployment, so I sent the “GT_channnel_CR6” deployment to the EXO (which should be its current deployment). I confirmed this deployment measures every 5 minutes and should send 11 columns via SDI-12. I pinged the EXO through the CR6 Terminal Emulator. It looks like all 11 columns are getting sent through the Terminal. However, there was a countdown from 62 seconds after the M! command. I checked the CR6 program, which currently scanned every 10 seconds and saves averages every 30 minutes. I thought maybe the 10-sec scan was cutting off some of the EXO data columns. I changed the program to scan every 1 minute, save “averages” every 1 minute, and added a “1/Wait” to the WaitonTimeout parameter for the SDI12Recorder instruction. WaitonTimeout is an optional parameters that was previously set to 0/default—although now that I’m reading about it again in the lab, this is only used for C! commands. We are using a M! command, which should be waiting anyways “until the sensor timeout expires or it receives the data from the sensor before continuing.” I also tried saving 20 columns of data, just in case the SDI-12 message was not getting parsed correctly and our missing data was in some column number >11. Measuring/saving data every 1 minute seemed to work, so I changed the final program to scan every 5 minutes (the EXO sampling frequency) and to save averages every 30 minutes. I also changed the DataInterval Lapses from 10 to 1, but in retrospect this wasn't necessary. I think the datalogger usually stores the initial time stamp and a data storage interval as opposed to storing the timestamp for every single record. As each record is stored, its timestamp is compared to the previous timestamp to check if there’s been any missed records (lapses). If there is a missing interval, then the timestamp of the new record is stored. However, now that I’m reading the Help section again in the lab, the “Lapses” parameter allocated memory in the data table for tracking lapses and storing the timelapse, not the maximum number of lapses allowed (which I what I thought in the field). So I guess I’ll change it back to 10 in the field. Next time, if the EXO data is still not working, I’ll bring its protective plastic tubing so I can bring the EXO back to the lab for further testing. We left at 10:30 PST. |
1 photos found

gilberttract_2024_09_12_084405.jpg ( 2024-09-12 17:08:26 ) Full size: 1296x960
Someone cleaning the eddy sensors
8 sets found
Can't check MBWPEESWGT_mixed
Can't check MBEEWPSWEPGT_cam
16 GT_met graphs found
4 GT_flux graphs found
3 GT_adcp graphs found
1 GT_cam graphs found
2 GT_usgs graphs found
2 GT_chanexo graphs found

