
Field Notes
<--2024-08-16 07:00:00 | 2024-09-12 08:55:00-->Other sites visited today: East End
Phenocam link: Searching...
Gilbert Tract: 2024-08-29 09:04:00 (DOY 242)
Author: Joe Verfaillie
Others: Daphne, Arman, Kuno
Summary: Standard fieldwork, Kuno and Arman doing another round of chamber measurements, remove CTD broken water level, swamp water for Charlie, swapped RH/T fan, Tried to improve EXO but need adapter.
| Gilbert Tract 2024-08-29 Daphne and I arrived at 9:04 PST. We let a whole bunch of cars through the gate that were all arriving for a construction meeting about adding a pump to control water in the unimproved section (impounded wetland) of Gilbert Tract. We talked to Katie Bandy on the way out, she was trying to fix their security camera. It was sunny with a cool fall breeze. The tide was low with a water level of 30cm at 9:34 PST. Kuno and Arman arrived earlier to do more CH4/N2O chamber measurements. Kuno says: ----------------- The CH₄ flux in the GT site is exceptionally high. I believe this is not solely due to diffusive flux but is also significantly influenced by the release of CH₄ that is trapped beneath the Azolla. I’ve observed that when deploying the chamber, there was a sudden and rapid increase in CH₄ concentrations—from around 2,500 ppb to over 100,000 ppb. This suggests an instant release of CH₄ when the plants are disturbed. We repeated the measurements multiple times to achieve a stable concentration increase, but it’s likely that the large values are still impacted by this continuous release of CH₄. Negative Correlation between CH₄ and N₂O: The second, and even larger, concern is the negative correlation between CH₄ and N₂O. I observed the same pattern in Malaysia and am uncertain whether this is a result of biological processes or a potential issue with the instrumentation. Specifically, higher CH₄ fluxes correspond with lower N₂O concentrations, with particularly rapid drops in N₂O occurring during sudden spikes in CH₄. I’ve reviewed the LI-COR manuals but haven’t found any information suggesting issues related to mixing ratios or similar factors. Moreover, LI-COR itself recommends using two analyzers simultaneously. ----------------- Daphne did the standard data collection while I cleaned the eddy sensors and radiometers and collected two gallons of swamp water for Charlie. The 7500 read 412ppm CO2, 700mmol/m3 H2O, 20.8C, 101.4kPa, 101SS - 102 after cleaning The 7700 read: 2.1ppm CH4, 45RSSI - 88 after cleaning. I topped off the wash reservoir. The eddy clock was adjusted from 9:09:30 to 9:10:50. After restarting logging there was a 7700 clock error that was fixed by restarting the 7550 box. Daphne collected the Song Meter Micro data, the battery was at 98%, she swapped the desiccant and synched its clock with her phone. I swapped the RH/T fan. The existing fan was not dead yet but was vibrating badly. The new fan was a small 12V fan instead of 24V and sounded like an angry bee when I connected it to the 24V power line. Daphne switched the power to 12V and all was well. The CTD water level was not reading and there were random dropouts in the diffuse PAR. There was a bunch of SDI-12 sensors (CTD, PRI, RH/T, diffuse PAR) and not clear at first where everyone was connected (C5 or C7). RH/T and PRI are on C7. Cycling power and tightening connections seemed to fix the diffuse PAR but not the CTD water level. We removed the CTD sn H21G200002433 for testing in the lab. It was about 10cm below the water surface with 10 to 20cm of muck below it. Daphne collected the miniDOT data, swapped its desiccant and measured the salinity Surface, 464.2uS, 21.3C The junction box on the boardwalk had been knocked loose from its mounts. I reattached it and we opened it up to check the connections inside - all seemed well. We added a moth ball here and some more in the met box. I tried to pull the extension cable out from under the tules but was beginning to make a path under the radiometers. Program updates: Remove PRI, remove EosGP columns, add mini-CH4 ???? The solar panels could use a cleaning next time. We went to the channel at about 10:05 PST to visit Flo. We pulled up the ADCP and the new EXO hoping to connect to it with Bluetooth. The mounts and cleanliness of the sensors looked fine. I tighten the cable ties and added the new EXO cable to the cable ties along the trolley handle. Daphne downloaded the ADCP data reset its clock and restarted logging. She downloaded the EXO data from the CR6 and saw that it was only recording every 3.5 hours. We wanted to update the EXO settings to add additional outputs to the SDI-12 message and now need to figure out why it is only reporting at 3.5 hour intervals and why we can't get the Bluetooth connection to work. Next time we need to bring the USB adapter. We updated the power terminal strip so that the EXO and CR6 don't share the same screw terminals. This power cycled everything but all seemed well afterwards. We left at 10:40 PST. Arman and Kuno left shortly afterwards. |
1 photos found
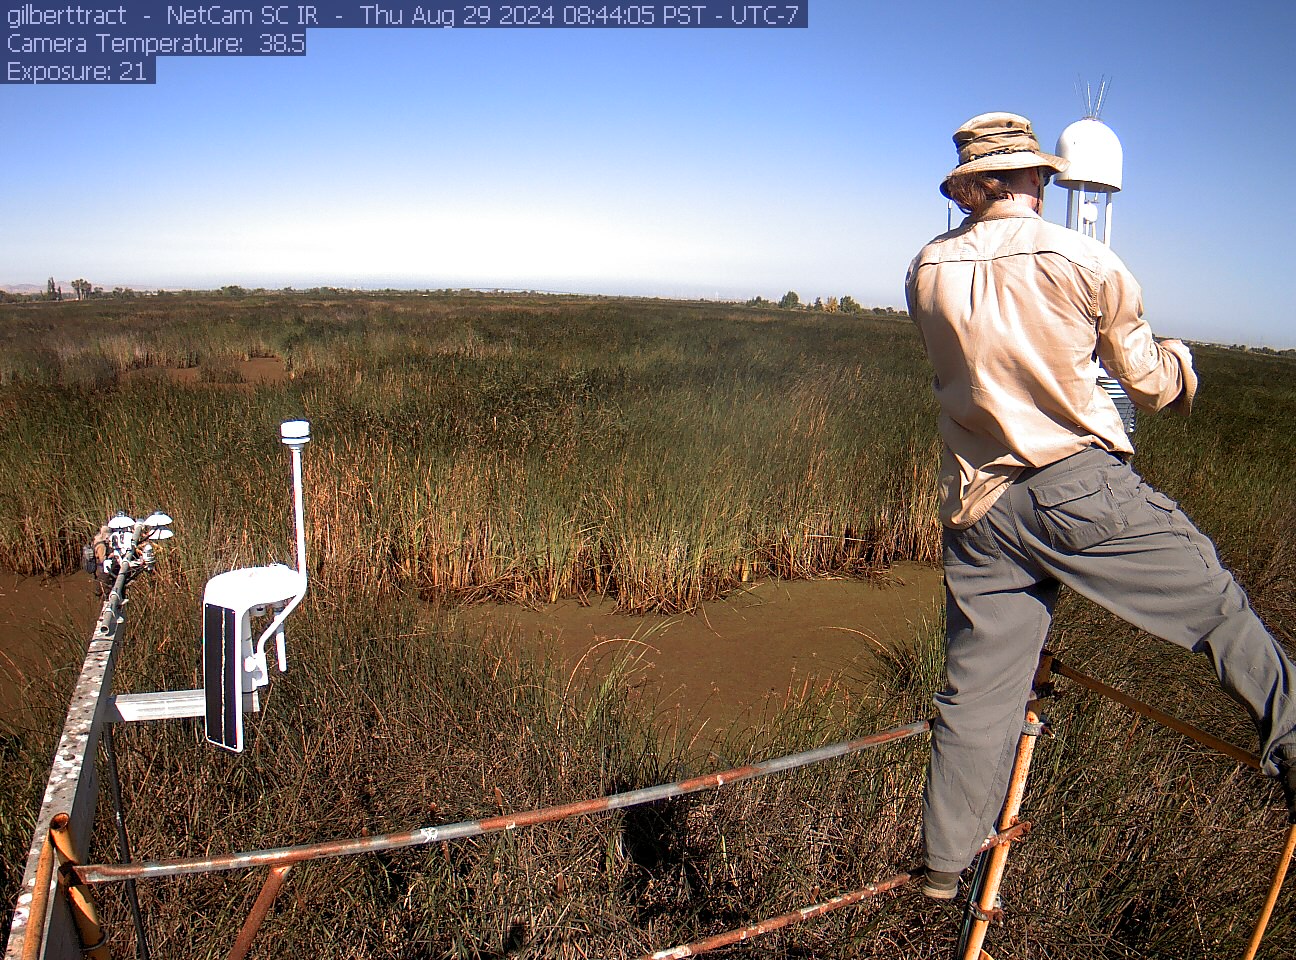
gilberttract_2024_08_29_084405.jpg ( 2024-08-29 17:08:08 ) Full size: 1296x960
Joe cleaning the eddy sensors
8 sets found
Can't check MBWPEESWGT_mixed
Can't check MBEEWPSWEPGT_cam
16 GT_met graphs found
4 GT_flux graphs found
3 GT_adcp graphs found
1 GT_cam graphs found
2 GT_usgs graphs found
2 GT_chanexo graphs found