Field Notes
<--2024-01-25 12:15:00 | 2024-02-16 10:45:00-->Other sites visited today: Vaira
Phenocam link: Searching...
Tonzi: 2024-02-09 12:50:00 (DOY 40)
Author: Joe Verfaillie
Others: Jackie
Summary: Jackie visiting from Keenan Lab, Cows destroyed things again, 5 days missing from Tower due to chewed wire shorting and popping breaker, FDs knocked over, Floor met SHF cables bad, CO2 profile down for calibration/repair
| Tonzi 2024-02-09 I arrived at about 12:50 with Jackie Reu from the Keenan Lab. Jackie is a new grad student this fall, likes field work, is interested in nutrient cycling but not sure what to pursue as a thesis. It was a lovely sunny but cool day fresh after a week or so of rain. Water, water everywhere, but I didn’t notice the pond looking a lot fuller. Maybe I was concentrating on getting through the puddles on the road. The AWD SUV managed just fine though. There are lots of branches down and maybe another tree or two. Must have been a strong storm out here. Cows have destroyed everything again. The electric fences around the Tower and the soil CO2 were both destroyed. Both FD chambers were on their sides but still running. A cow chewed the cable for the lowest GMP343 CO2 profile probe and shorted out the Tower power. This popped a breaker and after removing the chewed wire, resetting the breaker restored power but there are about five missing days of data. I showed Jackie around and got her set doing the soil moisture, the well depths and fixing cow fences. Thanks Jackie! I collected the Floor flux and well data. There was a small branch stuck on the sonic and 7500. The bird spikes on the 7500 are broken. I also replaced the cable to zcam3 that cows chewed and I spliced last time. The new line is in conduit most of the distance. The Floor 7500 read: 429.9ppm CO2, 358.3mmol/m3 H2O, 12.8C, 99.5kPa, 99.3SS I fixed the FD chambers and collected their data. I read the dendrometers and collected the Road well data. I was hoping to set the clocks on the point dendrometers but seems I still need a driver to talk to them. I removed the solar power connectors so that I can splice them to left over Arable solar panels in the lab. At tree Three the sensor was loose and seemed to be twisted out of its original location. I twisted it back and tightened the nuts – we need lock washers on these. There will be a jump in its readings. I collect the photos from Zcam2 and Zcam3. The box for Zcam1 is dry and must have been thoroughly tested by the storms. Time to get a camera back in there. After restoring power to the tower I collected the camera and flux data. The Tower 7500 read: 433.3ppm CO2, 317.6mmol/m3 H2O, 11.0C, 99.3kPa, 99.4SS We cleaned the radiometers, the BF3 has a little condensation inside and needs new desiccant. The CO2 profile system was acting funny even before the cow chewed its cable. The two remaining CO2 probes were not reading correctly. I decided to bring in all the probes to test and calibrate in the lab. I removed: 0.35m sn N2220007 1.8m sn N2210010 6m sn N2210009 The cows also messed with cables around the Floor met station. One SHF cable is broken (#5 I think). However the insulation on all of the SHF cables has rotted and pretty much fallen off. New wire will need to be spliced on all of them. I can probably do it in the field and not have to dig them all up. We left at about 16:20. Beautiful sunset on the way home. |
Field Data
No tank data
Well Depth
| Date | Location | Depth (feet) |
|---|---|---|
| 2024-02-09 | VR_well | 57.1 |
| 2024-02-09 | TZ_floor | 27.6 |
| 2024-02-09 | TZ_road | 35.1 |
| 2024-02-09 | TZ_tower | 31.7 |
No TZ Moisture Point data found
No VR Moisture Point data found
No TZ grass heigth found
No VR grass heigth found
Tree DBH
| Date | Tag# | Reading (mm) |
|---|---|---|
| 2024-02-09 | 1 | 20.5 |
| 2024-02-09 | 102 | 10.4 |
| 2024-02-09 | 2 | 16.1 |
| 2024-02-09 | 245 | 10.7 |
| 2024-02-09 | 3 | 7.2 |
| 2024-02-09 | 4 | 9.1 |
| 2024-02-09 | 5 | 17.9 |
| 2024-02-09 | 6 | 7.9 |
| 2024-02-09 | 7 | 15.3 |
| 2024-02-09 | 72 | 7.0 |
| 2024-02-09 | 79 | 7.1 |
No water potential data found
No TZ Grass Biomass data found
No TZ OakLeaves Biomass data found
No TZ PineNeedles Biomass data found
2 photos found

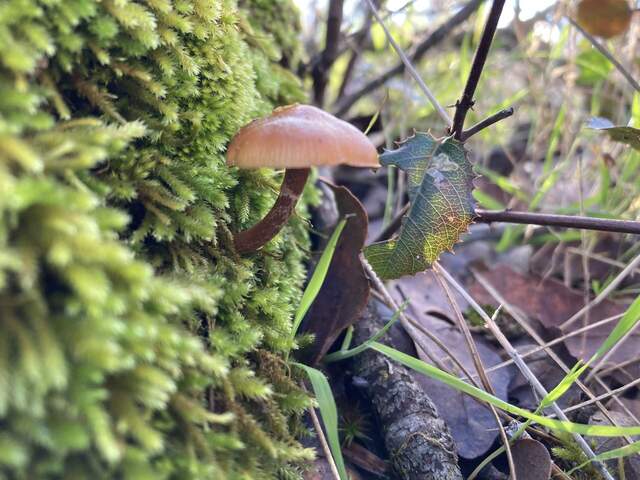
20240209TZ_MossAndMushroom.jpg ( 2024-02-09 15:57:54 ) Full size: 1920x1440
Small mushroom growing from moss at the base of a tree

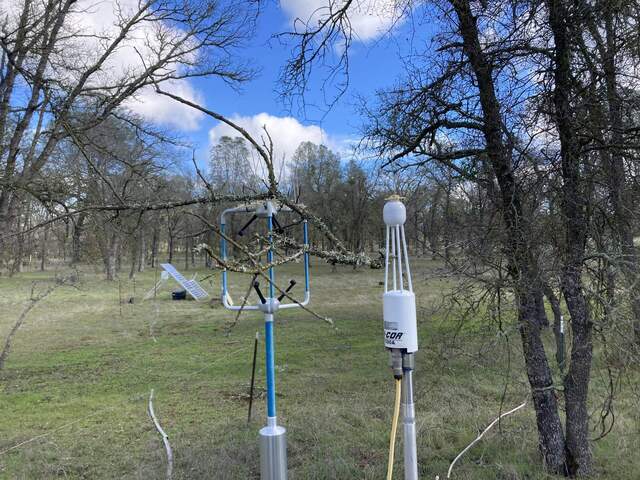
20230209TZ_BranchOnEddySensors.jpg ( 2024-02-09 13:34:30 ) Full size: 1920x1440
A small branch stuck on the Floor eddy sensors.
16 sets found
No data found for TZ_Fenergy.
11 TZ_tmet graphs found
No data found for TZ_soilco2.
Can't check TZ_mixed
3 TZ_mixed graphs found
1 TZ_fflux graphs found
8 TZ_fmet graphs found
No data found for TZ_tram.
3 TZ_co2prof graphs found
1 TZ_irt graphs found
No data found for TZ_windprof.
1 TZ_tflux graphs found
8 TZ_sm graphs found
Can't check TZ_met
1 TZ_met graphs found
Can't check TZVR_mixed
8 TZ_osu graphs found
3 TZ_fd graphs found
Tonzi Z-cam data

