Field Notes

<--2010-05-13 11:00:00 | 2010-06-10 10:00:00-->
Other sites visited today: Vaira | Twitchell Rice | Sherman Island
Phenocam link: Searching...

Tonzi: 2010-05-28 05:10:00 (DOY 148)
Author: Siyan Ma
Others:


When: Date: 5/28/2010 , Day: 148 , Watch Time: 5:10 am .
Where: Tonzi/Vaira Ranch
Who: Siyan
Weather: partially cloudy
Phenology: yellow flowers (HYGL), green oak leaves

Tonzi

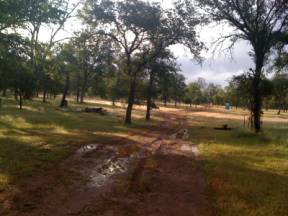
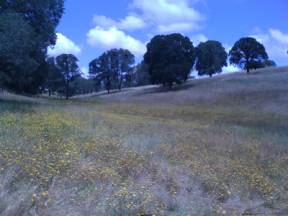
Muddy dirt road under trees at Tonzi

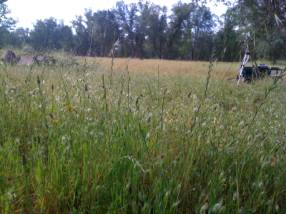
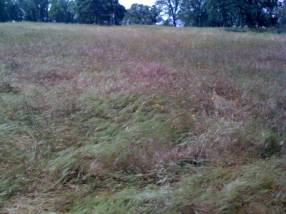
Grasses gone to seed at Tonzi


Vaira

Brown grasses, yellow flowers, trees at Vaira

Dying grasses at Vaira


Summary
  1. Pre-dawn leaf water potential: oak leaf= -5 bar; pin needle=-6 bar.
  2. A-Ci curves for oak and gray pine
  3. check and download data at Tower, Floor, and Vaira
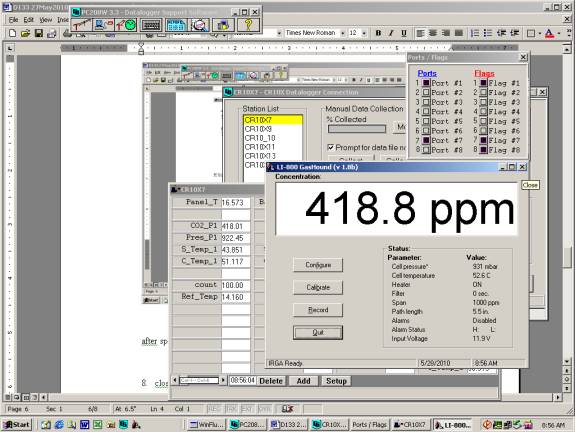
  4. calibrate Li-800 in the field
  5. collected samples of grasses, oak leaves and pin needles
  6. dendrometers
  7. soil moisture
  8. groundwater well:

Date

DOY

Location

Depth from the black thing (feet)

5/28/2010

148

Floor

20.41


Tower

24.31


roadside

29.48

Vaira_Grass Site
  1. Fence and gate power: 12 v.
  2. Panel and Batteries: ok v; ok amps; ok amps.
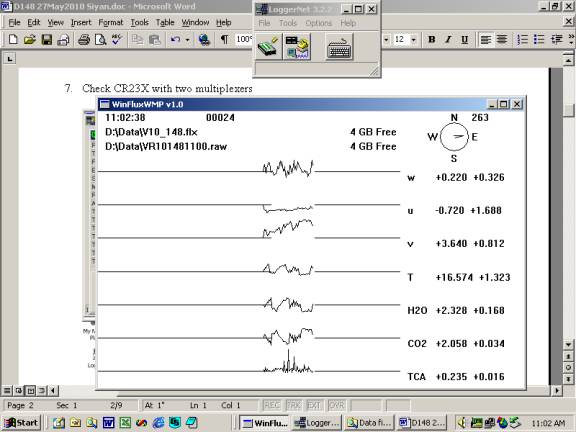
  3. Reading from Gillsonic screen before downloading data. (The value of H2O and CO2 should be in the range of 0 – 5 v.)

Vaira Gill sonic plots screen before downloading data
  1. downloading data YES!
  2. Check the fans of air temp. and relative humidity sensors at Vaira. YES!
  3. Check MD-9 system connections YES!
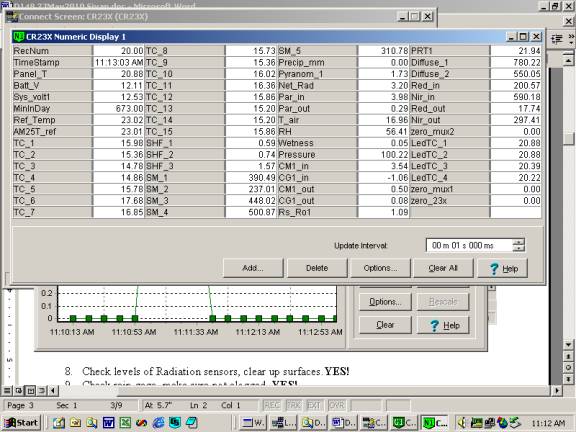
  4. Check CR23X with two multiplexers

I click rain gage several times to test whether it is functioning.
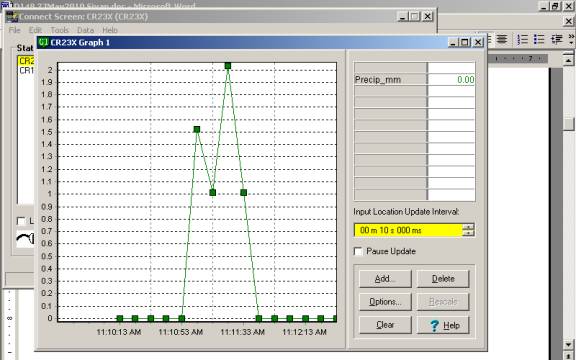
Screen shot of plot of rain gauge test data
Screen shot of table showing rain gauge test data
  1. Check levels of Radiation sensors, clear up surfaces.YES!
  2. Check rain gage, make sure not clogged. YES!
  3. Closed gate and set up fence. YES!

Tonzi_Tower Site

  1. Fence and gate power: 12 v.
  2. Panel and Batteries: ok v; ok amps; ok amps.
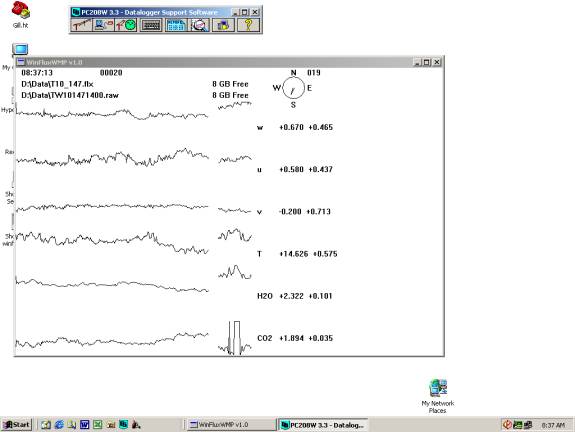
  3. Reading from Gillsonic screen before downloading data. (The value of H2O and CO2 should be in the range of 0 – 5 v.)

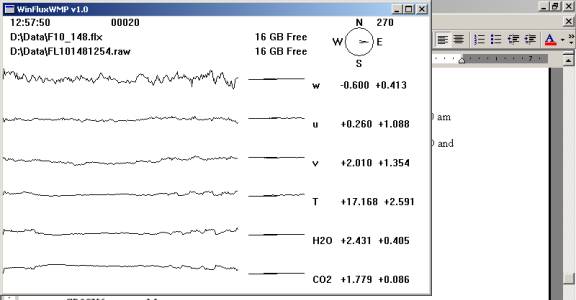
Tower Gill sonic plots screen before downloading data
  1. downloading data YES!
  2. check the fans of air temp. and relative humidity sensors on the tower and the floor. YES!
  3. Check rain gage, make sure not clogged. YES!
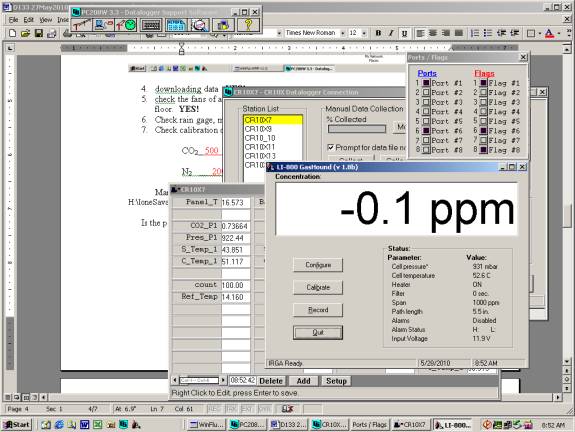
  4. Check calibration cylinders;

CO2 500 psig; flow 20 psi; 418.8 ppm.
N2 2000 psig; flow 20 psi.
Manually calibrate Li-800. Following Ted’s instruction: H:\IoneSavanna_2004\Tower_2004\CO2Profile\LI800_Calibration_Procedure_2Nov04.txt
Is the pump running‌ YES.
Screen shot of Li-800 calibration pre-cal
After zero
Screen shot of Li-800 calibration zero post-cal

after span [CO2]=418.8ppm
Screen shot of Li-800 calibration span post-cal
  1. close gate and set up fence. YES!

Toniz_Floor Site
  1. Fence and gate power: 12 v.
  2. Panel and Batteries: ok v; ok amps; ok amps.
  3. Reading from Gillsonic screen before downloading data. (The value of H2O and CO2 should be in the range of 0 – 5 v.)

Floor Gill sonic plots screen before downloading data
  1. downloading data YES!
  2. Check MD-9 system connections YES!

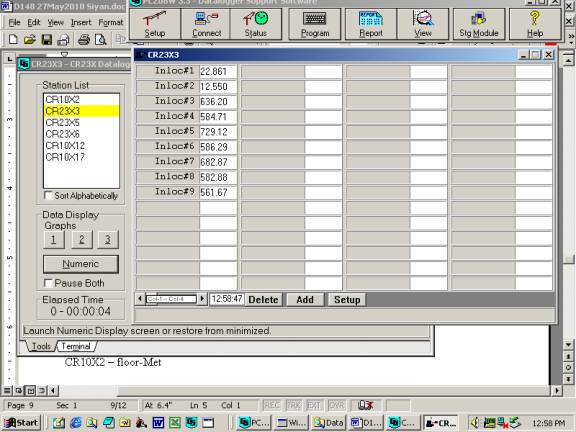
CR23X3 – floor-Met
Screen shot of soil moisture data logger table


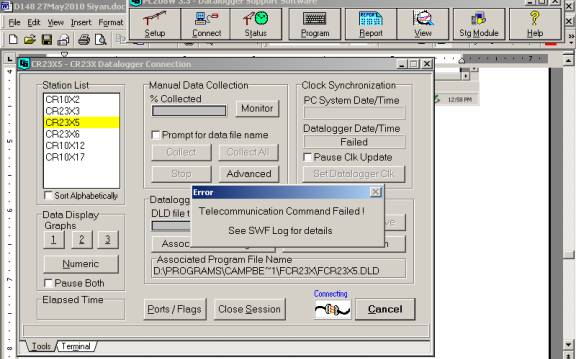
CR23X5 – soil CO2 profile

Screen shot of failed connection with soil co2 data logger
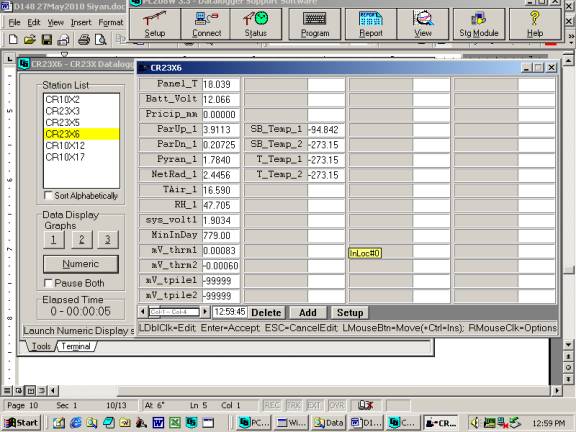
CR23X6 – tower-Met
Screen shot of tower met data logger table
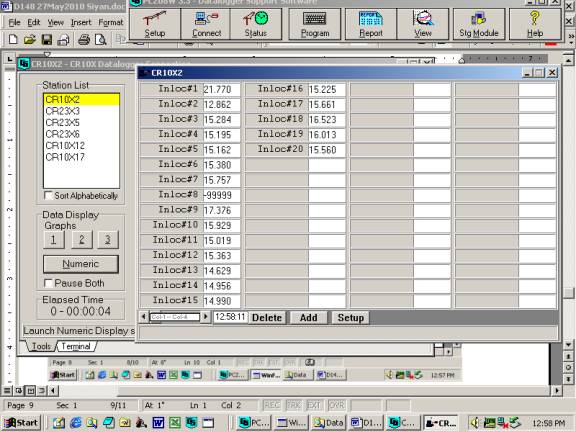
CR10X2 – floor-Met
Floor Gill sonic plots screen before downloading data
  1. Soil CO2 profile:

Reading from panels of analyzers

depth

Open

order

depth

Tree

order

2cm (1%)

1030

1

2cm (1%)

2940

1

4cm

1500

2

4cm

3740

4

8cm

2450

3

8cm

3460

2

16cm

2440

4

16cm

7720

3
  1. Close gate and set up fence. YES!


tonzi

7931AFE

402165

574B4B

402FF3

574632

7A432E

7A3C6E

7A3B40

7A4AAA

5/28/2010

148


sm


0-15

22.3

13.2

22.0

15.9

18.5

15.0

21.4

16.8

10.0

15-30

17.0

22.2

23.4

17.9

23.1

13.0

25.2

19.7

7.2

30-45

23.7

27.6

31.0

21.2

32.4

15.1

26.2

22.6

21.2

45-60

25.1

23.1

56.0

38.2

35.4

18.2

23.4

34.2

17.3


A6D882B

A3D04E8

A6D72F5


0-15

22.3

15.3

17.6


15-30

17.0

4.8

21.9


30-45

23.5

21.8

23.5


45-60

31.9

32.5

39.4


vaira

57318a

7933dee


0-15

12.7

8.7


15-30

16.1

17.5


30-45

16.5

21.8


45-60

22.8

27.7


Tonzi


Dendrometer


Date

Day

Tag #

Reading (mm)


5/28/2010

148

72

10.9


79

14.8


102

x


245

12.2


250

21.9

(reset to 10.5 on May 7, 2009)


1

21


2

10.9


3

18.9


4

9.9


5


7

12

133


8

16.5

11828


71

X


77

X


78

X


248

X

broken


255

X


‌252‌

X


6

X


Notes: “X” means not working any more.
Dendrometers installed by Gretchen group
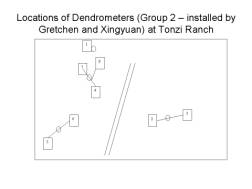
Diagram of dendrometer tree locations

Field Data

No tank data

Well Depth

DateLocationDepth (feet)
2010-05-28TZ_floor20.41
2010-05-28TZ_road29.48
2010-05-28TZ_tower24.31

No TZ Moisture Point data found

No VR Moisture Point data found

No TZ grass heigth found

No VR grass heigth found

No TZ Tree DBH found

Water Potential - mode: raw

TimeSpeciesTreereadings (bar)
2010-05-28 04:16:00 OAK UNKNOWN -4 -2.5 -2 -5.5 -6 -11 -3.9 -2.5 -3
2010-05-28 04:16:00 PINE UNKNOWN -5.5 -5.5 -4 -6.5 -9.5 -3.5 -5.5 -6
2010-05-28 12:02:00 OAK UNKNOWN -9 -10.5 -13.5 -8.5 -24 -13.5 -12.5 -20.5 -25
2010-05-28 12:02:00 PINE UNKNOWN -4 -2 -8 -14.5 -11 -5.5 -16

No TZ Grass Biomass data found

No TZ OakLeaves Biomass data found

No TZ PineNeedles Biomass data found

13 photos found
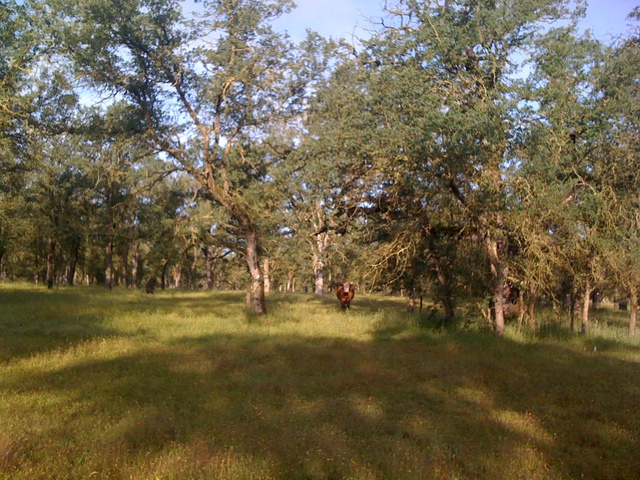
Cow in the oak savanna
TZ_IMG_0531.jpg ( 2010-05-28 07:07:56 ) Full size: 1600x1200
Cow in the oak savanna
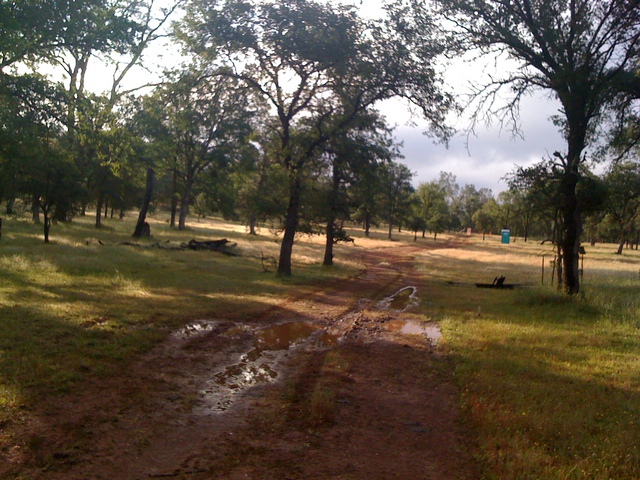
Puddles on the dirt road at the oak savanna
TZ_IMG_0532.jpg ( 2010-05-28 07:08:10 ) Full size: 1600x1200
Puddles on the dirt road at the oak savanna
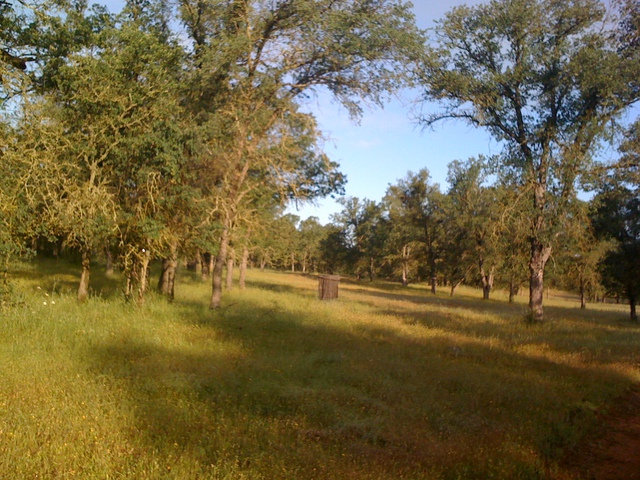
Litter bag at the oak savanna
TZ_IMG_0533.jpg ( 2010-05-28 07:08:31 ) Full size: 1600x1200
Litter bag at the oak savanna
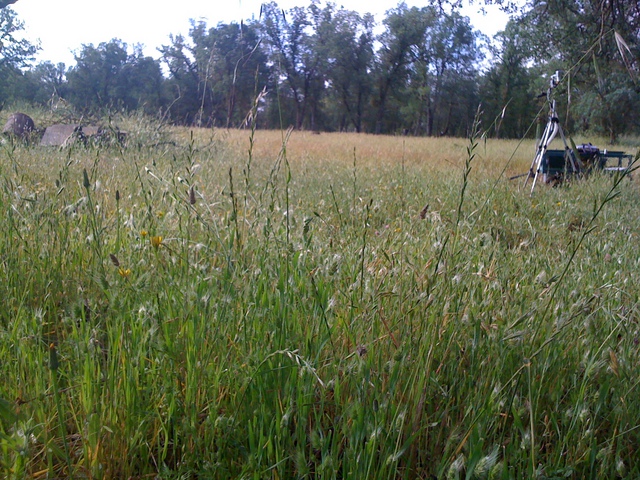
Grasses gone to seed and LI-6400
TZ_IMG_0534.jpg ( 2010-05-28 08:13:13 ) Full size: 1600x1200
Grasses gone to seed and LI-6400
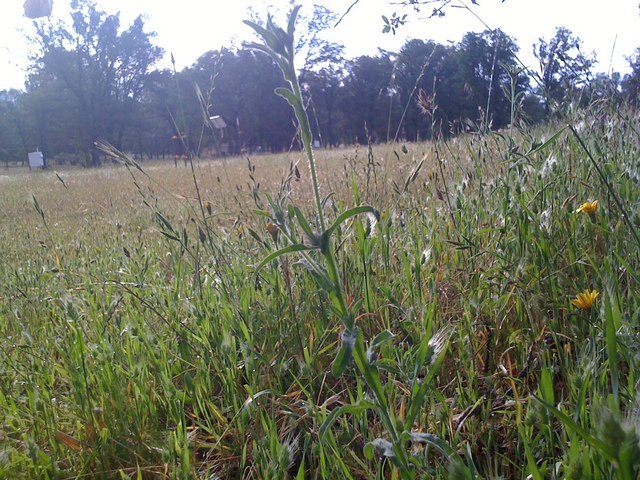
Grasses gone to seed
TZ_IMG_0535.jpg ( 2010-05-28 08:13:22 ) Full size: 1600x1200
Grasses gone to seed
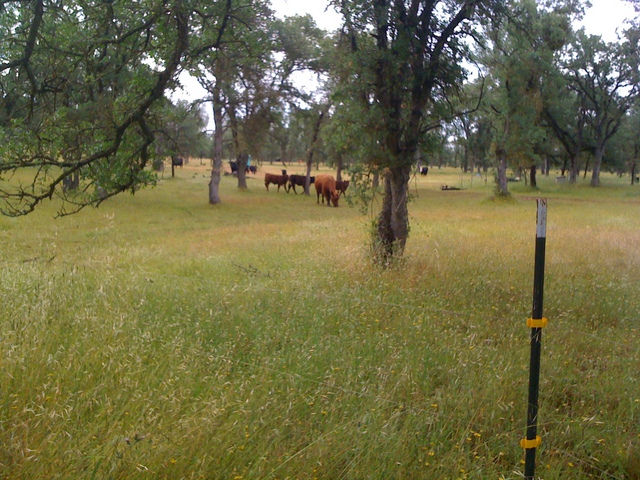
Cows in the oak savanna
TZ_IMG_0536.jpg ( 2010-05-28 08:43:28 ) Full size: 1600x1200
Cows in the oak savanna
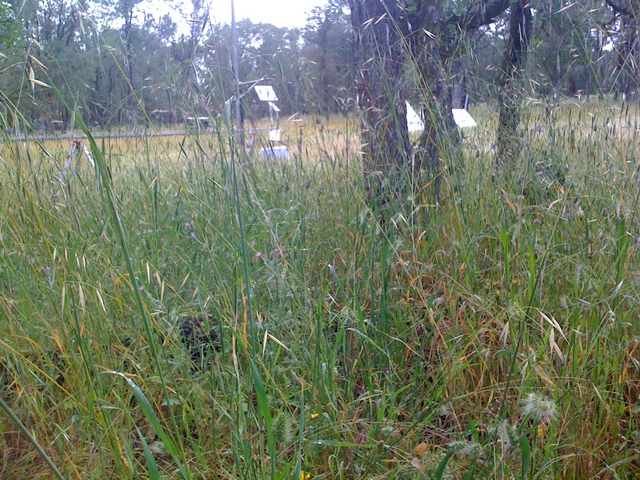
Close up of grasses gone to seed at oak savanna
TZ_IMG_0537.jpg ( 2010-05-28 08:46:19 ) Full size: 1600x1200
Close up of grasses gone to seed at oak savanna
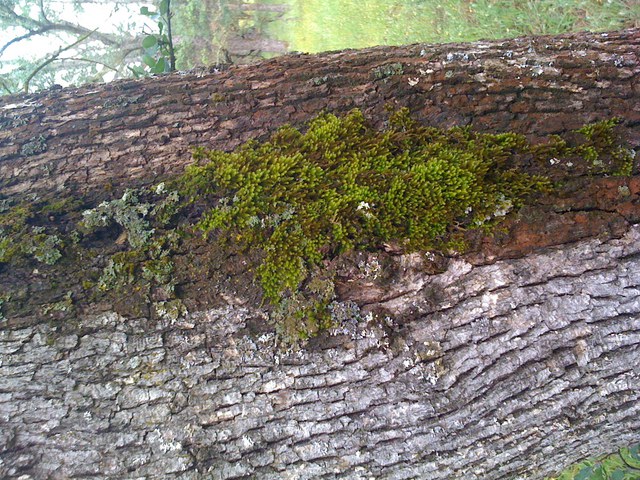
Moss on oak tree trunk
TZ_IMG_0538.jpg ( 2010-05-28 08:55:56 ) Full size: 1600x1200
Moss on oak tree trunk
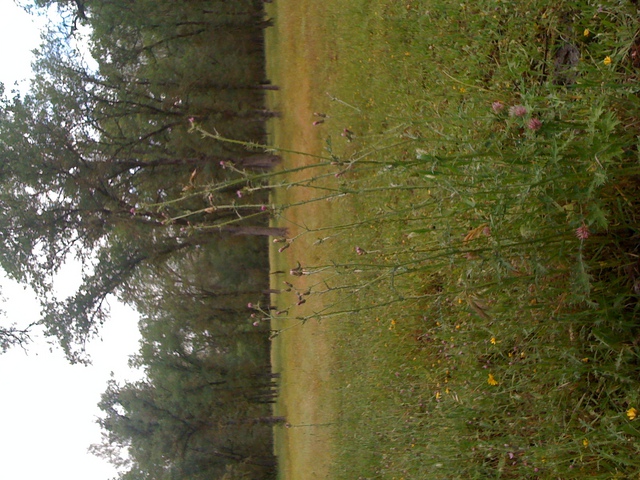
Thistles in the oak savanna
TZ_IMG_0539.jpg ( 2010-05-28 08:58:50 ) Full size: 1600x1200
Thistles in the oak savanna
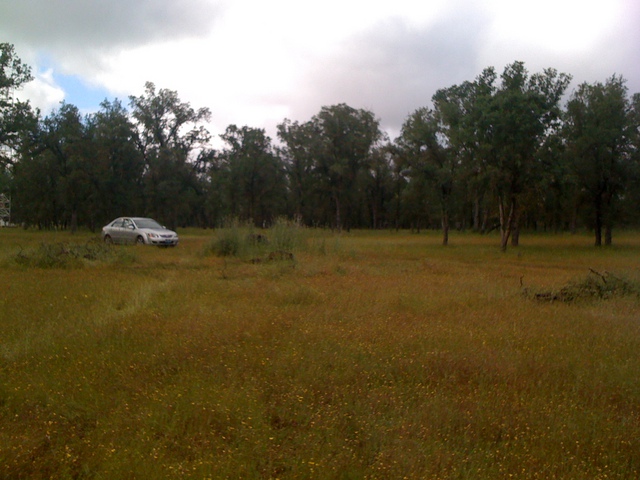
Oak savanna with cloudy skies and car
TZ_IMG_0540.jpg ( 2010-05-28 08:59:25 ) Full size: 1600x1200
Oak savanna with cloudy skies and car
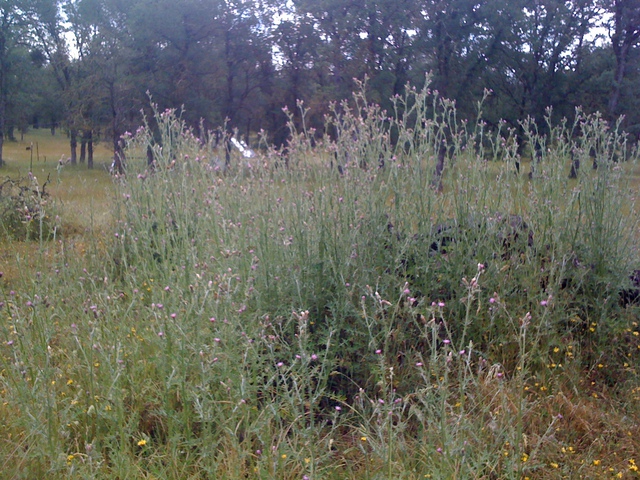
A patch of thistles at the oak savanna
TZ_IMG_0541.jpg ( 2010-05-28 08:59:59 ) Full size: 1600x1200
A patch of thistles at the oak savanna
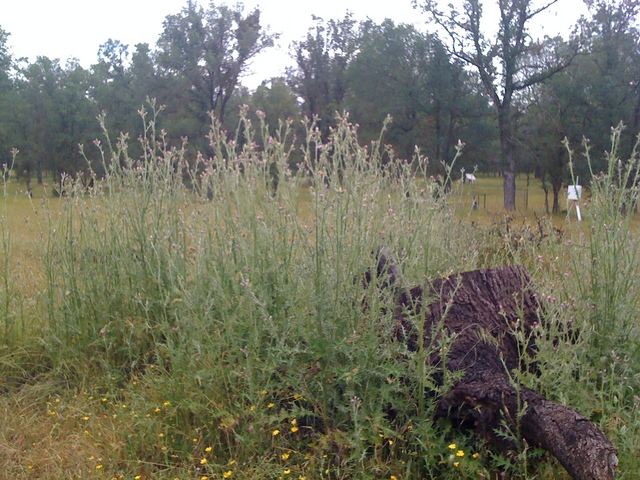
A patch of thistles at the oak savanna
TZ_IMG_0542.jpg ( 2010-05-28 09:00:12 ) Full size: 1600x1200
A patch of thistles at the oak savanna
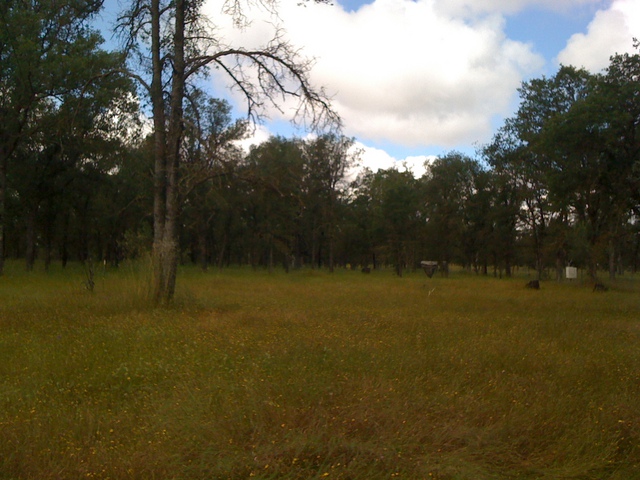
Oak savanna with dead oak and clouds
TZ_IMG_0543.jpg ( 2010-05-28 09:54:32 ) Full size: 1600x1200
Oak savanna with dead oak and clouds

Graphs display:
16 sets found

No data found for TZ_Fenergy.
11 TZ_tmet graphs found

Explore the graph:Tonzi Tower Met: Temperature and Power in a new window

Explore the graph:Tonzi Tower Met: Solar Radiation in a new window

Explore the graph:Tonzi Tower Met: IRT Sensors in a new window

Explore the graph:LED Sensor Incoming in a new window

Explore the graph:LED Sensor Outgoing in a new window

Explore the graph:4-Band Solar Radiation in a new window

Explore the graph:Air Temperature Profile in a new window

Explore the graph:Relativity Humidity Profile in a new window

Explore the graph:Tonzi Tower PRI in a new window

Explore the graph:SRS PRI/NDVI in a new window

Explore the graph:SRS NDVI in a new window

11 TZ_soilco2 graphs found

Explore the graph:Tonzi Soil CO2 Profile: Open (East) CO2 in a new window

Explore the graph:Tonzi Soil CO2 Profile: Tree (West) CO2 in a new window

Explore the graph:Tonzi Soil CO2 Profile: Open (East) Temperatures in a new window

Explore the graph:Tonzi Soil CO2 Profile: Tree (West) Temperatures in a new window

Explore the graph:Tonzi Soil CO2 Profile: Upper CO2 in a new window

Explore the graph:Tonzi Soil CO2 Profile: Lower CO2 in a new window

Explore the graph:Tonzi Soil CO2 Profile: Upper Temperatures in a new window

Explore the graph:Tonzi Soil CO2 Profile: Lower Temperatures in a new window

Explore the graph:Tonzi Soil CO2 Profile: Power and Temperature in a new window

Explore the graph:Tree 2 Soil CO2 in a new window

Explore the graph:Tree 2 Soil Temperature in a new window

Can't check TZ_mixed
3 TZ_mixed graphs found

Explore the graph:Tonzi PPT in a new window

Explore the graph:Tonzi CO2 and H2O Densities in a new window

Explore the graph:Air Pressure in a new window

No data found for TZ_fflux.
8 TZ_fmet graphs found

Explore the graph:Soil Heat Flux in a new window

Explore the graph:Tonzi Soil Temperature Set A in a new window

Explore the graph:Tonzi Soil Temperatures Set B in a new window

Explore the graph:Tonzi Soil Temperatures Set C in a new window

Explore the graph:Tonzi Soil Temperature Set D in a new window

Explore the graph:Well Level in a new window

Explore the graph:Well Water Temperature in a new window

Explore the graph:Soil Water Potential in a new window

1 TZ_tram graphs found

Explore the graph:Tonzi Tram Incoming PAR in a new window

3 TZ_co2prof graphs found

Explore the graph:Tower CO2 Profile Concentrations in a new window

Explore the graph:Tower CO2 Profile Cell Pressure in a new window

Explore the graph:CO2 Profile Sensor Temperature in a new window

No data found for TZ_irt.
No data found for TZ_windprof.
No data found for TZ_tflux.
2 TZ_sm graphs found

Explore the graph:Floor Solar Radiations in a new window

Explore the graph:TZ Soil Moisture in a new window

Can't check TZ_met
1 TZ_met graphs found

Explore the graph:Floor and Tower RH in a new window

Can't check TZVR_mixed
No data found for TZ_osu.
No data found for TZ_fd.
Tonzi Z-cam data

plot of Tonzi z-cam LAI

plot of Tonzi z-cam gap fration