Field Notes
<--2010-05-13 13:00:00 |
2010-06-24 10:00:00-->
Other sites visited today:
Twitchell Rice |
Tonzi |
Sherman Island
Phenocam link:
Searching...Vaira: 2010-05-28 05:10:00 (DOY 148)
Author: Siyan Ma
Others:
When: Date: 5/28/2010 , Day: 148 , Watch Time: 5:10 am .
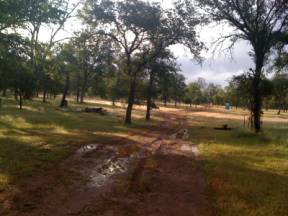
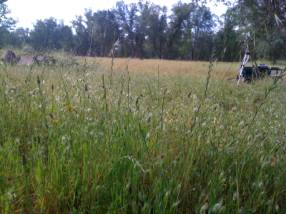
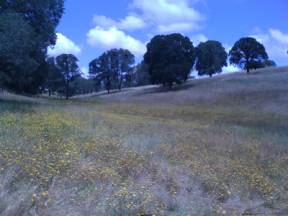
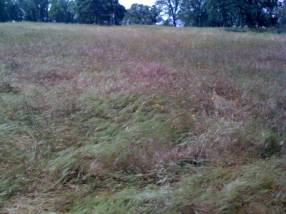
Where: Tonzi/Vaira Ranch
Who: Siyan
Weather:
partially cloudy
Phenology:
yellow flowers (HYGL), green oak leaves
Summary
- Pre-dawn leaf water
potential: oak leaf= -5 bar; pin needle=-6 bar.
- A-Ci curves for oak and gray
pine
- check and download data at
Tower, Floor, and Vaira
- calibrate Li-800 in the
field
- collected samples of grasses,
oak leaves and pin needles
- dendrometers
- soil moisture
- groundwater well:
Date
|
DOY
|
Location
|
Depth
from the black thing (feet)
|
5/28/2010
|
148
|
Floor
|
20.41
|
|
|
Tower
|
24.31
|
|
|
roadside
|
29.48
|
Vaira_Grass
Site
- Fence and gate power: 12 v.
- Panel and Batteries: ok v; ok amps; ok amps.
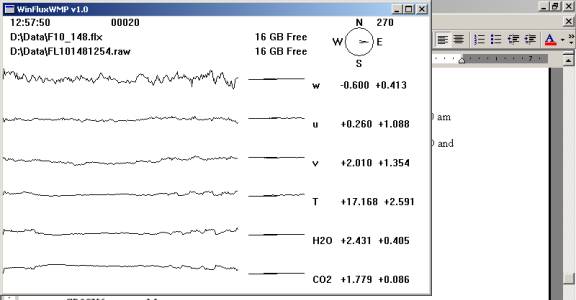
- Reading from Gillsonic screen
before downloading data. (The
value of H2O and CO2 should be in the range of 0 – 5
v.)
- downloading data YES!
- Check the fans of air temp.
and relative humidity sensors at Vaira. YES!
- Check MD-9 system connections
YES!
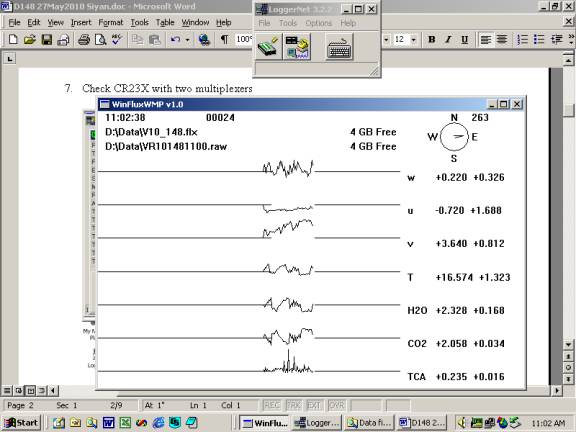
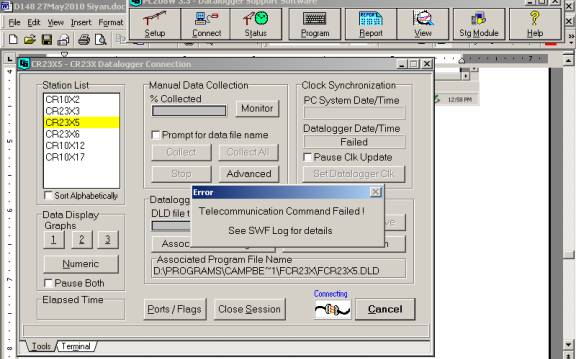
- Check CR23X with two
multiplexers
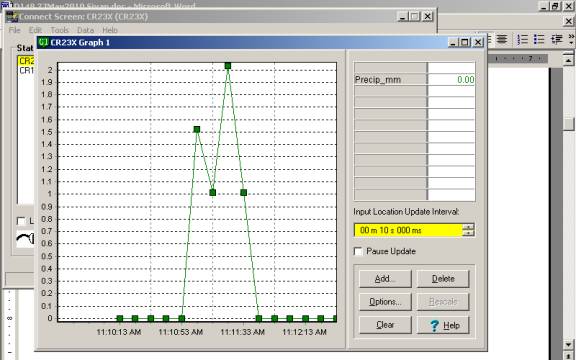
I click rain gage
several times to test whether it is functioning.
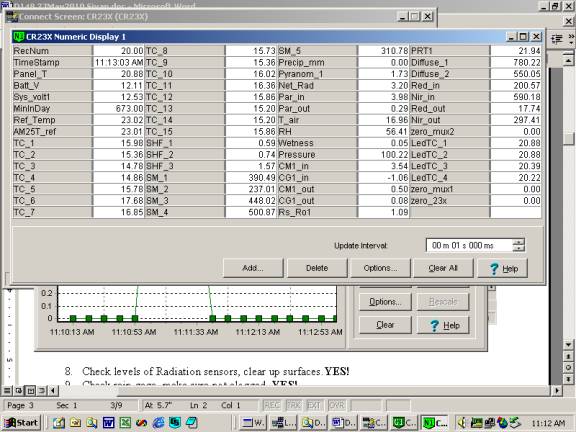
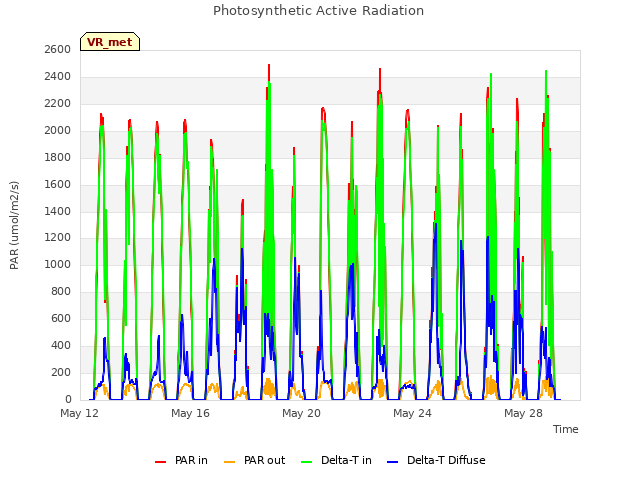
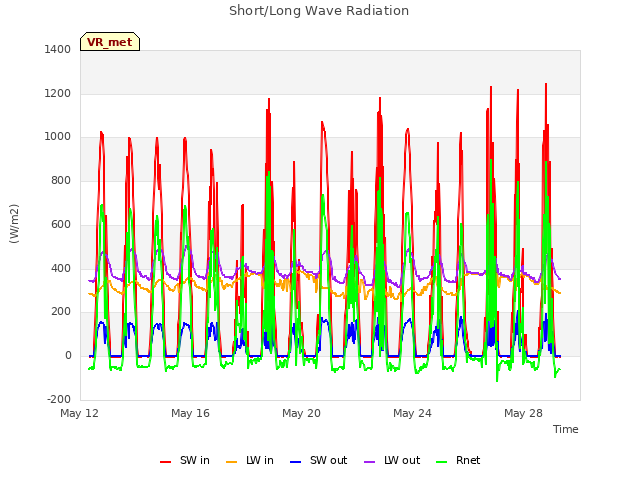
- Check levels of Radiation
sensors, clear up surfaces.YES!
- Check rain gage, make sure
not clogged. YES!
- Closed gate and set up fence.
YES!
Tonzi_Tower Site
- Fence and gate power: 12
v.
- Panel and Batteries: ok
v; ok
amps; ok
amps.
- Reading from Gillsonic screen
before downloading data. (The
value of H2O and CO2 should be in the range of 0 – 5
v.)
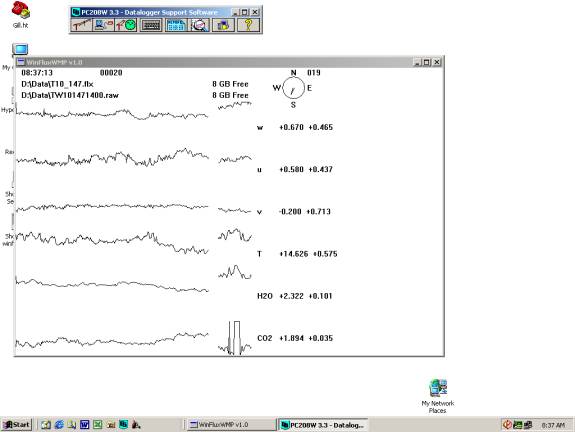
- downloading data YES!
- check the fans of air temp.
and relative humidity sensors on the tower and the floor. YES!
- Check rain gage, make sure
not clogged. YES!
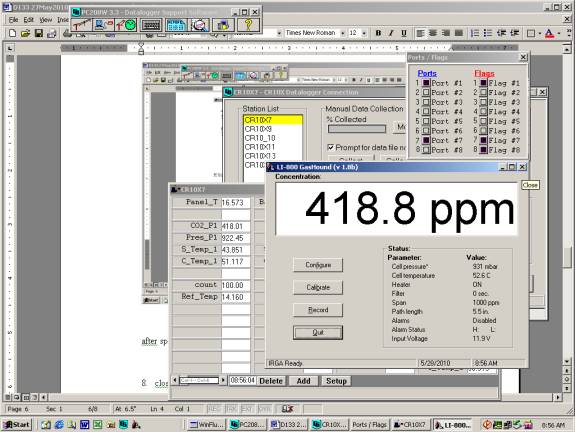
- Check calibration cylinders;
CO 2 500 psig; flow 20 psi; 418.8 ppm.
N 2 2000
psig; flow 20
psi.
Manually calibrate Li-800. Following Ted’s instruction: H:\IoneSavanna_2004\Tower_2004\CO2Profile\LI800_Calibration_Procedure_2Nov04.txt
Is the pump running YES.

After zero
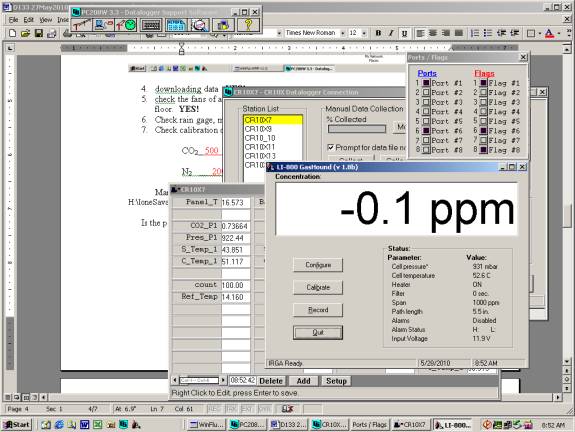
after span [CO2]=418.8ppm
- close gate and set up fence. YES!
Toniz_Floor
Site
- Fence and gate power: 12
v.
- Panel and Batteries: ok
v; ok
amps; ok
amps.
- Reading from Gillsonic screen
before downloading data. (The
value of H2O and CO2 should be in the range of 0 – 5
v.)
- downloading data YES!
- Check MD-9 system
connections YES!
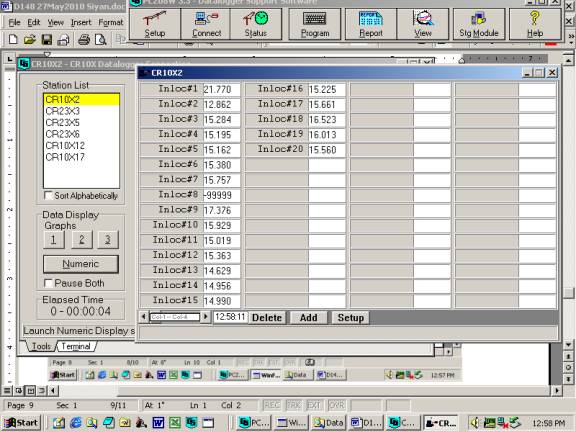
CR23X3 – floor-Met
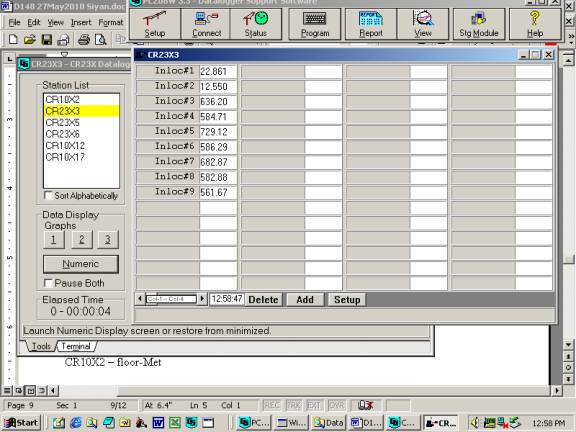
CR23X5 – soil CO 2
profile
CR23X6 – tower-Met
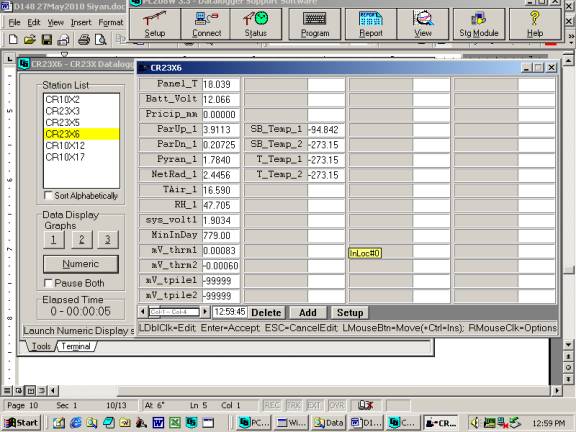
CR10X2 – floor-Met
- Soil CO2 profile:
Reading
from panels of analyzers
depth
|
Open
|
order
|
depth
|
Tree
|
order
|
2cm
(1%)
|
1030
|
1
|
2cm
(1%)
|
2940
|
1
|
4cm
|
1500
|
2
|
4cm
|
3740
|
4
|
8cm
|
2450
|
3
|
8cm
|
3460
|
2
|
16cm
|
2440
|
4
|
16cm
|
7720
|
3
|
- Close gate and set up fence. YES!
tonzi
|
7931AFE
|
402165
|
574B4B
|
402FF3
|
574632
|
7A432E
|
7A3C6E
|
7A3B40
|
7A4AAA
|
5/28/2010
|
148
|
|
|
|
|
|
|
|
|
|
sm
|
|
|
|
|
|
|
|
|
0-15
|
22.3
|
13.2
|
22.0
|
15.9
|
18.5
|
15.0
|
21.4
|
16.8
|
10.0
|
15-30
|
17.0
|
22.2
|
23.4
|
17.9
|
23.1
|
13.0
|
25.2
|
19.7
|
7.2
|
30-45
|
23.7
|
27.6
|
31.0
|
21.2
|
32.4
|
15.1
|
26.2
|
22.6
|
21.2
|
45-60
|
25.1
|
23.1
|
56.0
|
38.2
|
35.4
|
18.2
|
23.4
|
34.2
|
17.3
|
|
|
|
|
|
|
|
|
|
|
|
A6D882B
|
A3D04E8
|
A6D72F5
|
|
|
|
|
|
|
|
|
|
|
|
|
|
|
|
|
0-15
|
22.3
|
15.3
|
17.6
|
|
|
|
|
|
|
15-30
|
17.0
|
4.8
|
21.9
|
|
|
|
|
|
|
30-45
|
23.5
|
21.8
|
23.5
|
|
|
|
|
|
|
45-60
|
31.9
|
32.5
|
39.4
|
|
|
|
|
|
|
|
|
|
|
|
|
|
|
|
|
vaira
|
57318a
|
7933dee
|
|
|
|
|
|
|
|
0-15
|
12.7
|
8.7
|
|
|
|
|
|
|
|
15-30
|
16.1
|
17.5
|
|
|
|
|
|
|
|
30-45
|
16.5
|
21.8
|
|
|
|
|
|
|
|
45-60
|
22.8
|
27.7
|
|
|
|
|
|
|
|
Tonzi
|
|
|
|
|
|
Dendrometer
|
|
|
|
|
|
|
|
|
|
|
Date
|
Day
|
Tag #
|
Reading (mm)
|
|
|
5/28/2010
|
148
|
72
|
10.9
|
|
|
|
|
79
|
14.8
|
|
|
|
|
102
|
x
|
|
|
|
|
245
|
12.2
|
|
|
|
|
250
|
21.9
|
(reset to 10.5 on May 7, 2009)
|
|
|
|
1
|
21
|
|
|
|
|
2
|
10.9
|
|
|
|
|
3
|
18.9
|
|
|
|
|
4
|
9.9
|
|
|
|
|
5
|
|
|
|
|
|
7
|
12
|
133
|
|
|
|
8
|
16.5
|
11828
|
|
|
|
71
|
X
|
|
|
|
|
77
|
X
|
|
|
|
|
78
|
X
|
|
|
|
|
248
|
X
|
broken
|
|
|
|
255
|
X
|
|
|
|
|
252
|
X
|
|
|
|
|
6
|
X
|
|
|
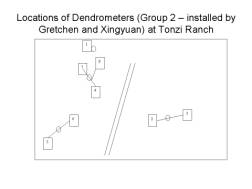
Notes:
“X” means not working any more.
Dendrometers
installed by Gretchen group
|
Field Data
No tank data
Well Depth
| Date | Location | Depth (feet) |
|---|
| 2010-05-28 | TZ_floor | 20.41 |
| 2010-05-28 | TZ_road | 29.48 |
| 2010-05-28 | TZ_tower | 24.31 |
No TZ Moisture Point data found
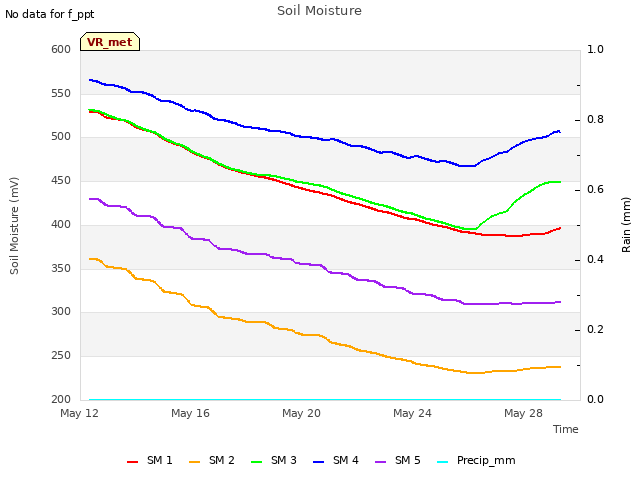
No VR Moisture Point data found
No TZ grass heigth found
No VR grass heigth found
No VR Tree DBH found
No water potential data found
No VR Grass Biomass data found
No VR OakLeaves Biomass data found
No VR PineNeedles Biomass data found
0 photos found
9 sets found
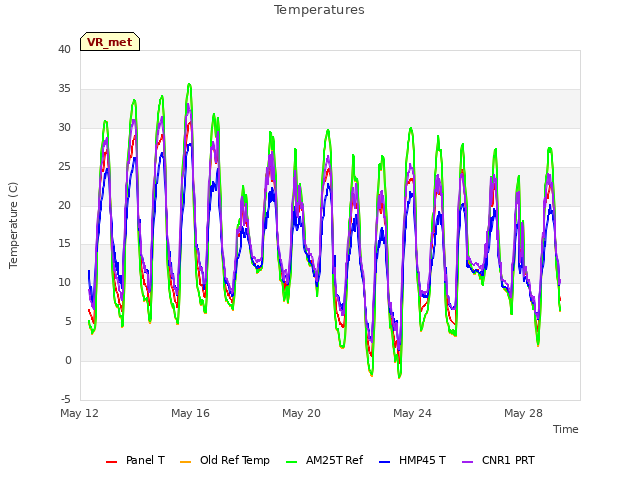
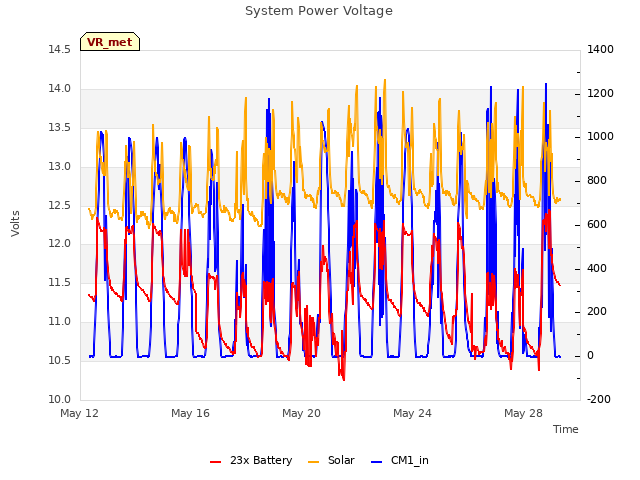
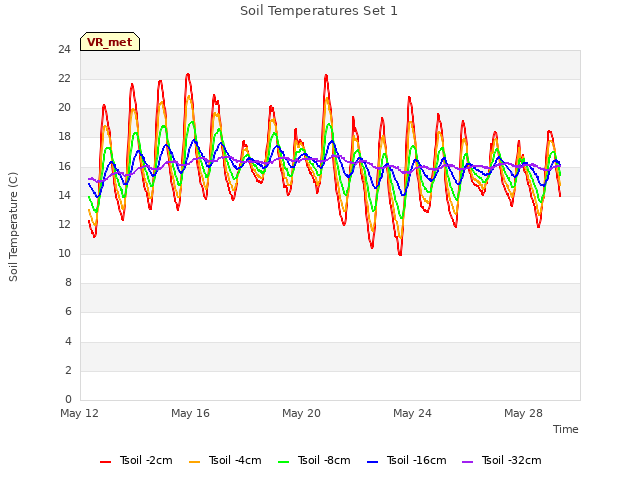
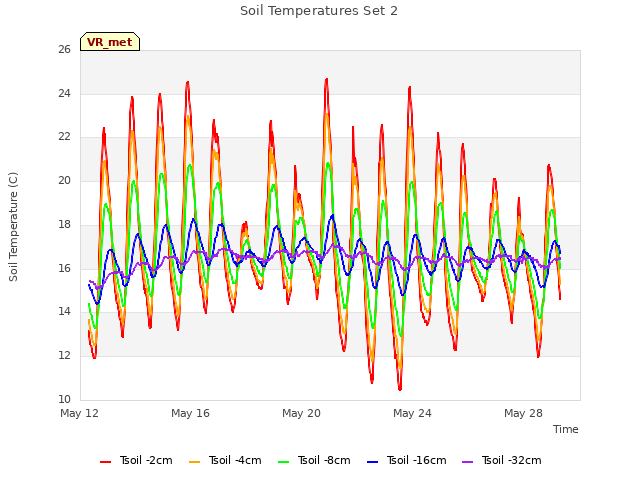
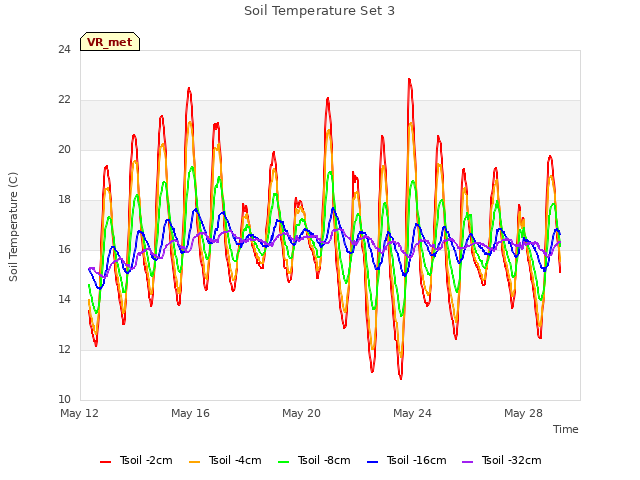
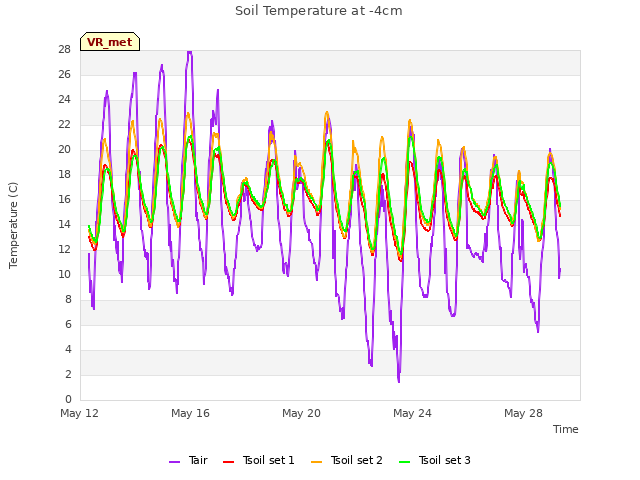
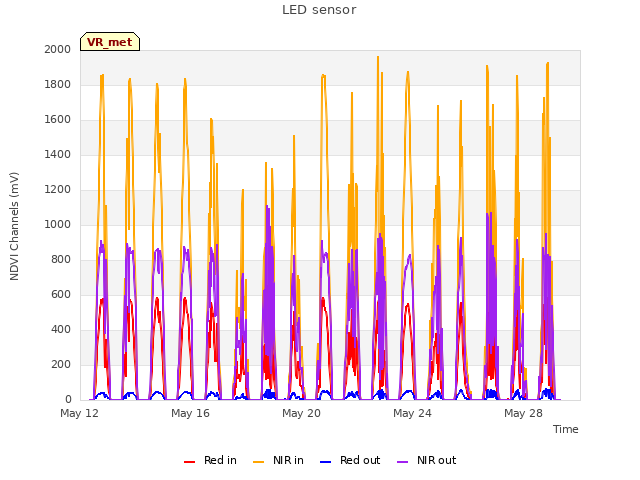
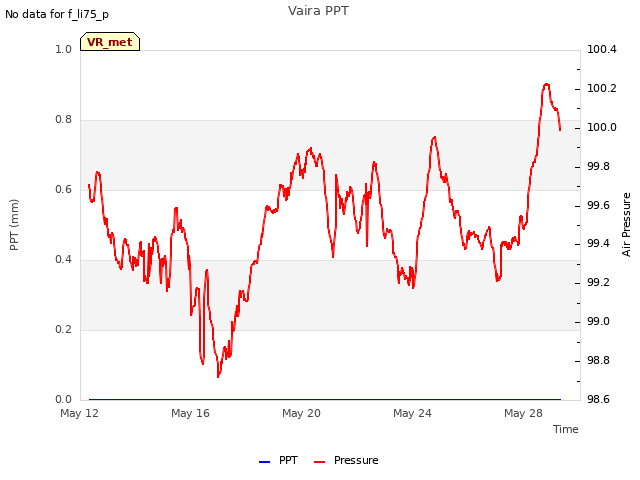
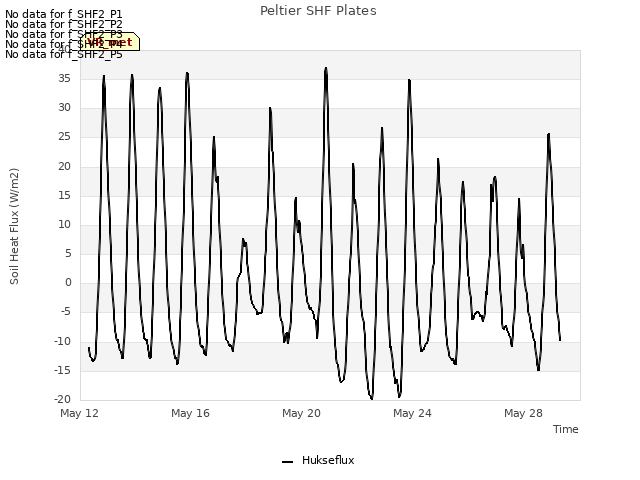
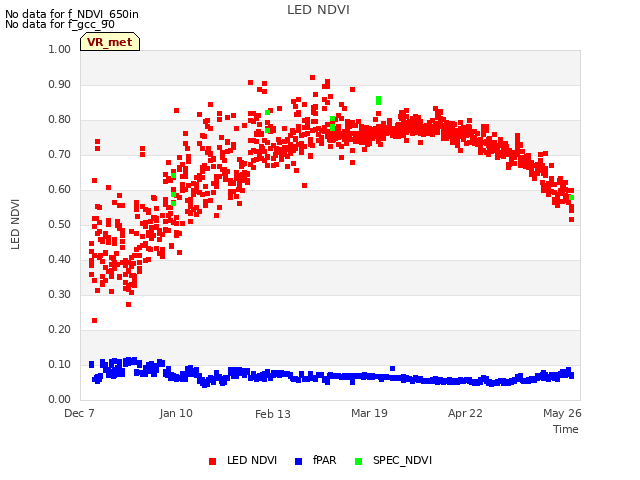
16 VR_met graphs found
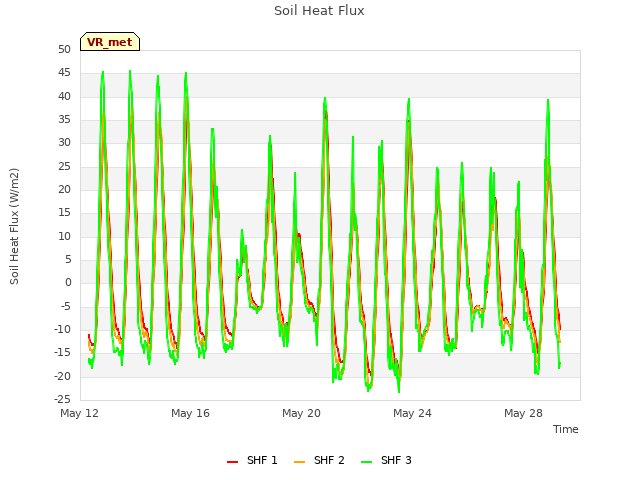


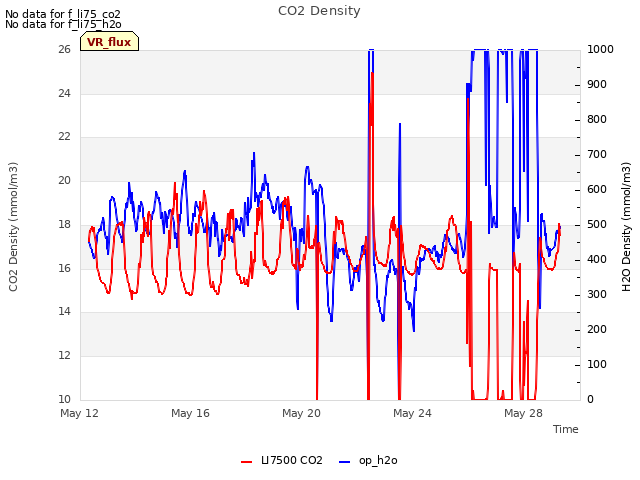
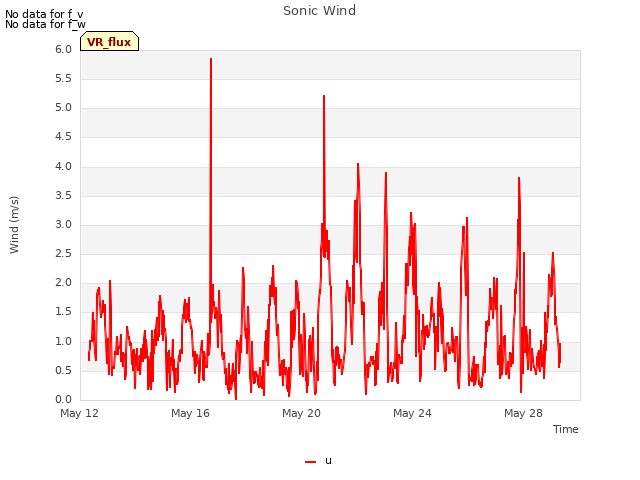
2 VR_flux graphs found
No data found for VR_soilco2.
No data found for VR_pond.
Can't check TZVR_mixed
No data found for VR_fd.
No data found for VR_processed.
No data found for VR_arable.
No data found for VR_soilvue.