
Field Notes
<--2010-05-13 10:00:00 | 2010-05-28 05:10:00-->Other sites visited today: Vaira | Tonzi | Twitchell Rice
Phenocam link: Searching...
Tonzi: 2010-05-13 11:00:00 (DOY 133)
Author: Siyan Ma
Others: Joe, Anders
|
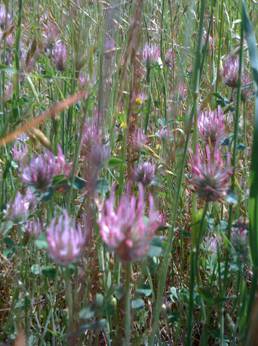
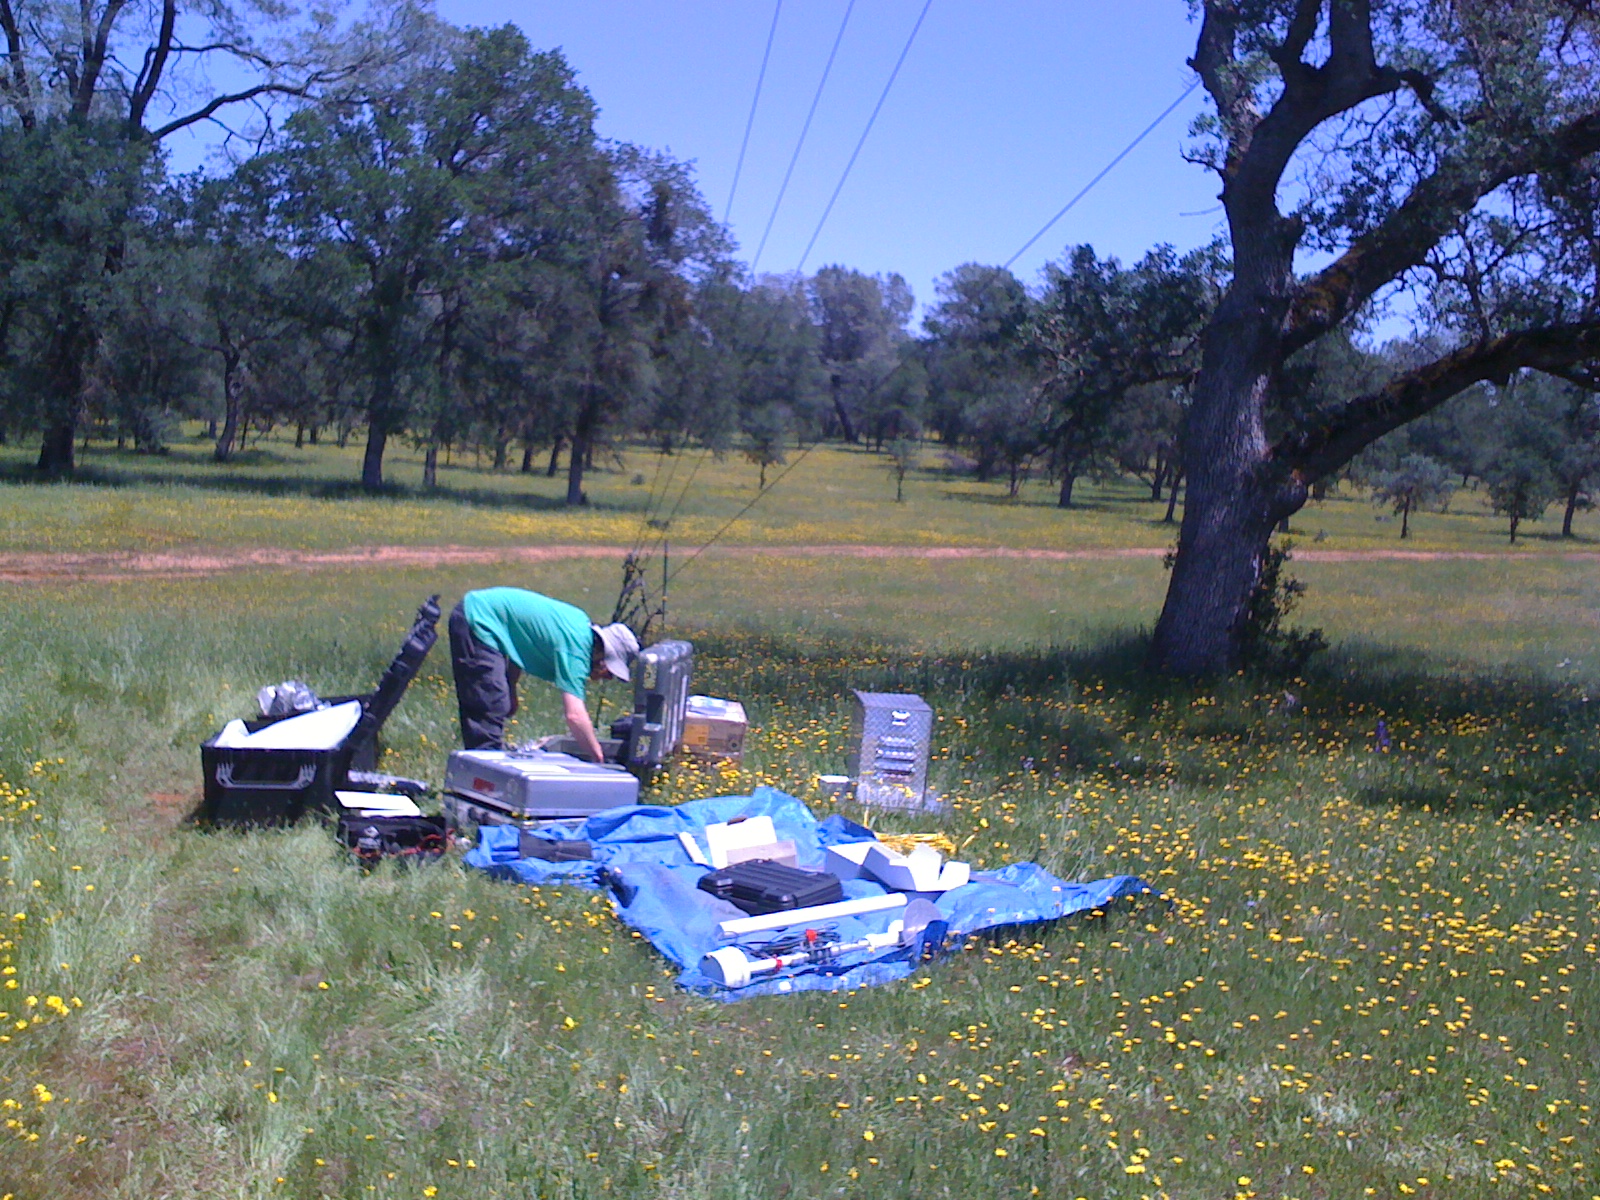
When: Date: 5/13/2010 , Day: 133 , Watch Time: 11:00 . Where: Tonzi/Vaira Ranch Who: Siyan, Joe, Ameriflux Anders came to Toniz and started calibration measurements for 10 days. Weather: sunshine, not too hot Phenology: grasses at development stage, a lot of yellow flowers, green oak leaves, fully extended, met Mr. Tonzi.
Summary
Vaira_Grass Site
Before swapping 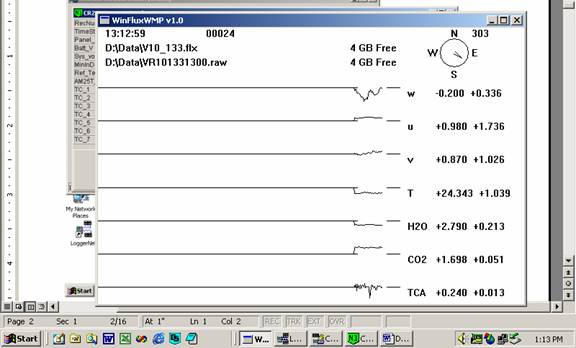
Tonzi_Tower Site
After swap: remove #976; install #65 
CO2 500 psig; flow psi; 418.8 ppm. N2 new tank psig; flow psi. Manually calibrate Li-800. Following Ted’s instruction: H:\IoneSavanna_2004\Tower_2004\CO2Profile\LI800_Calibration_Procedure_2Nov04.txt Is the pump running YES. 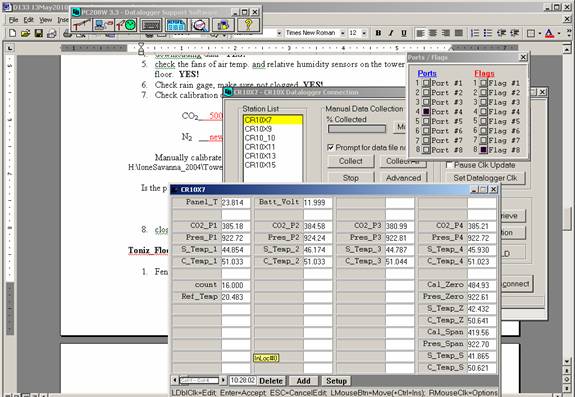
Toniz_Floor Site
Before swap 
Remove #1594; install #35 
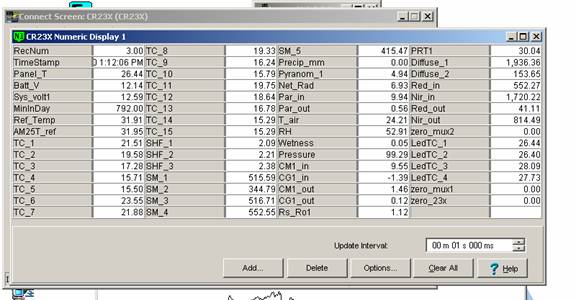
CR23X3 – floor-Met 
CR23X5 – soil CO2 profile 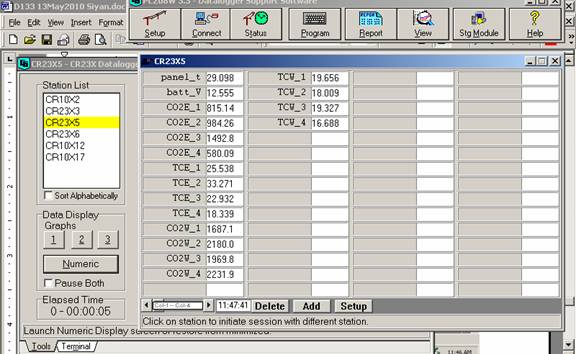
CR23X6 – tower-Met 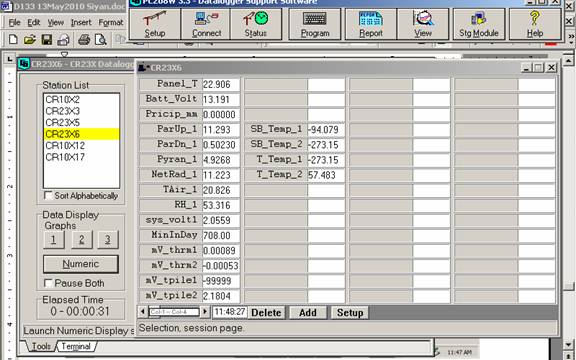
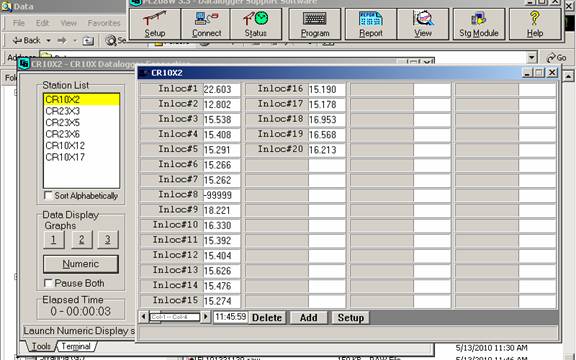
CR10X2 – floor-Met
Reading from panels of analyzers
Notes: “X” means not working any more. Dendrometers installed by Gretchen group 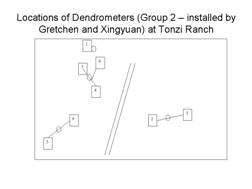
| ||||||||||||||||||||||||||||||||||||||||||||||||||||||||||||||||||||||||||||||||||||||||||||||||||||||||||||||||||||||||||||||||||||||||||||||||||||||||||||||||||||||||||||||||||||||||||||||||||||||||||||||||||||||||||||||||||||||||||||||||||||||||||||||||||||||||||||||||||||||||||||||||||||||||||||||||||||||||||||||||||||||||||||||||||||||||||||||||||||||||||||||||||||||||||||||||||||||||
Field Data
No tank data
Well Depth
| Date | Location | Depth (feet) |
|---|---|---|
| 2010-05-13 | TZ_floor | 20.48 |
| 2010-05-13 | TZ_road | 29.7 |
| 2010-05-13 | TZ_tower | 24.35 |
No TZ Moisture Point data found
No VR Moisture Point data found
No TZ grass heigth found
No VR grass heigth found
No TZ Tree DBH found
No water potential data found
No TZ Grass Biomass data found
No TZ OakLeaves Biomass data found
No TZ PineNeedles Biomass data found
9 photos found
TZ_IMG_0487.jpg ( 2010-05-13 11:02:36 ) Full size: 1600x1200
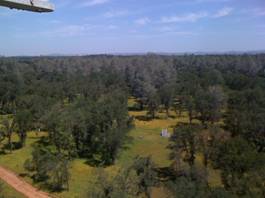
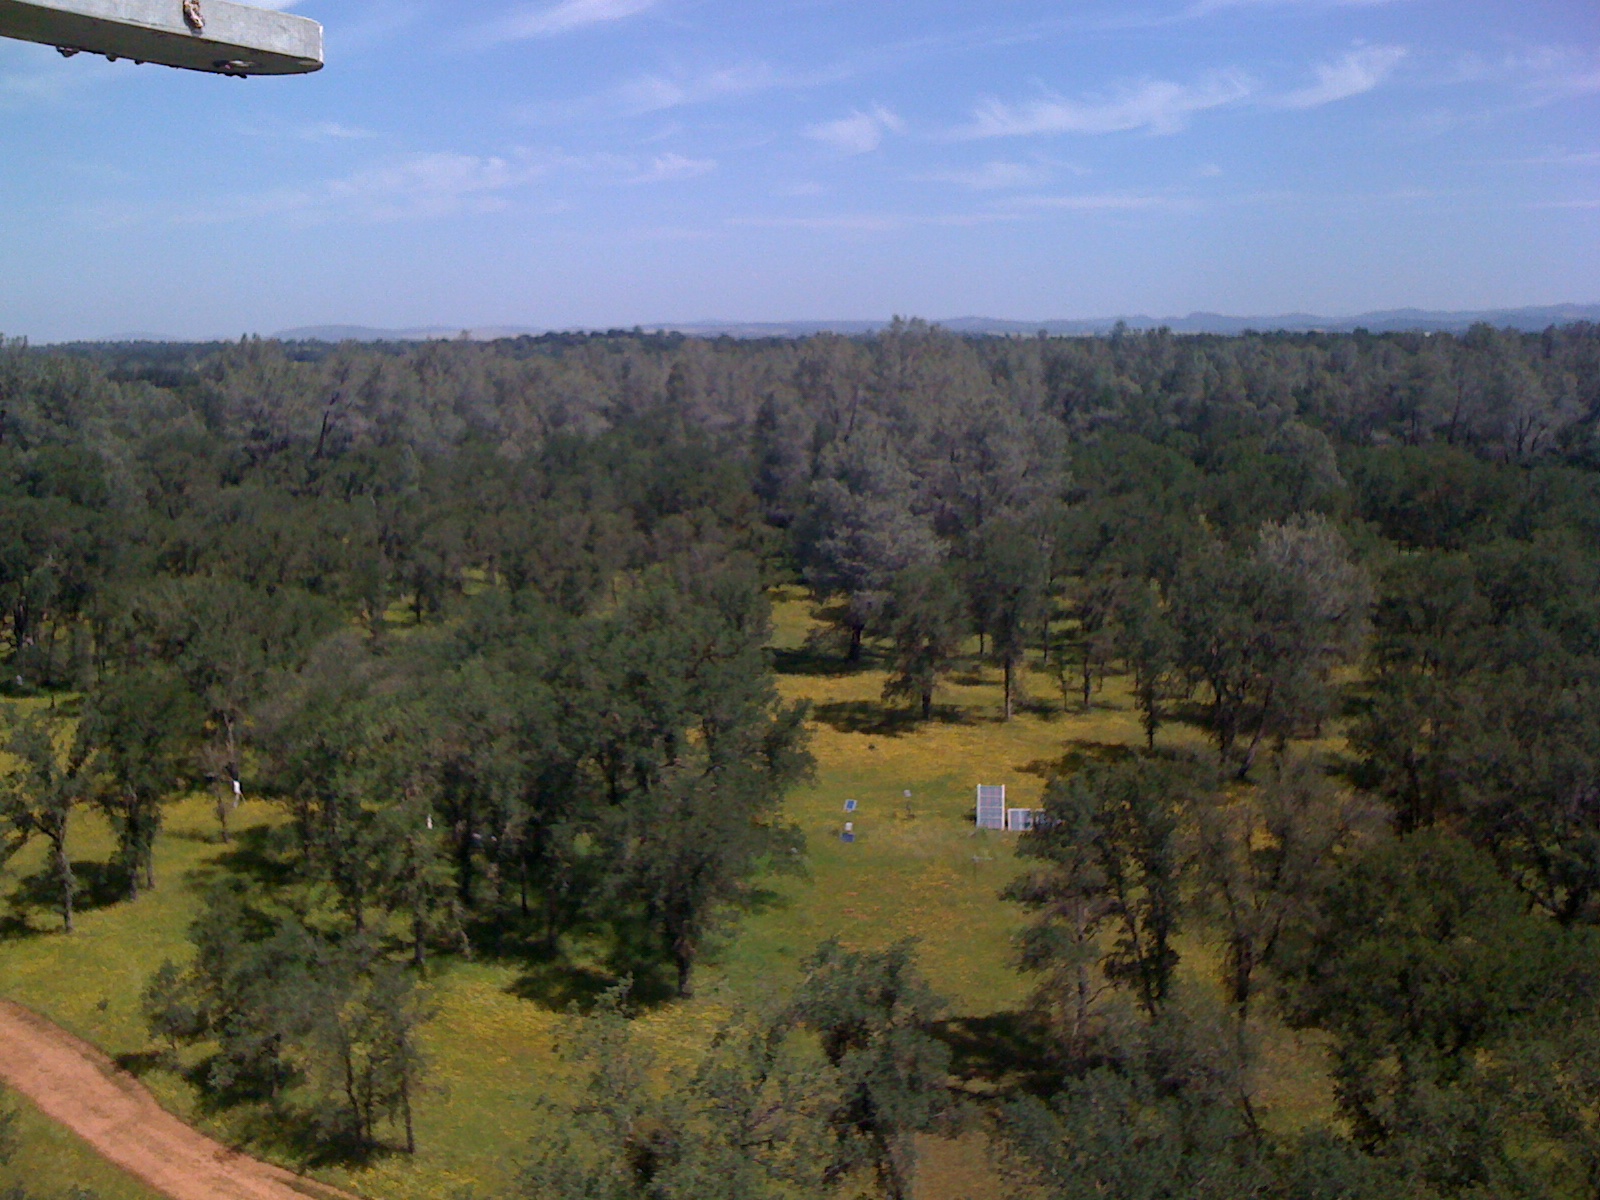
View of Floor site from tower top at the oak savanna
TZ_IMG_0488.jpg ( 2010-05-13 11:02:47 ) Full size: 1600x1200
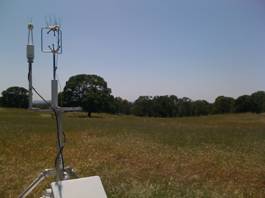
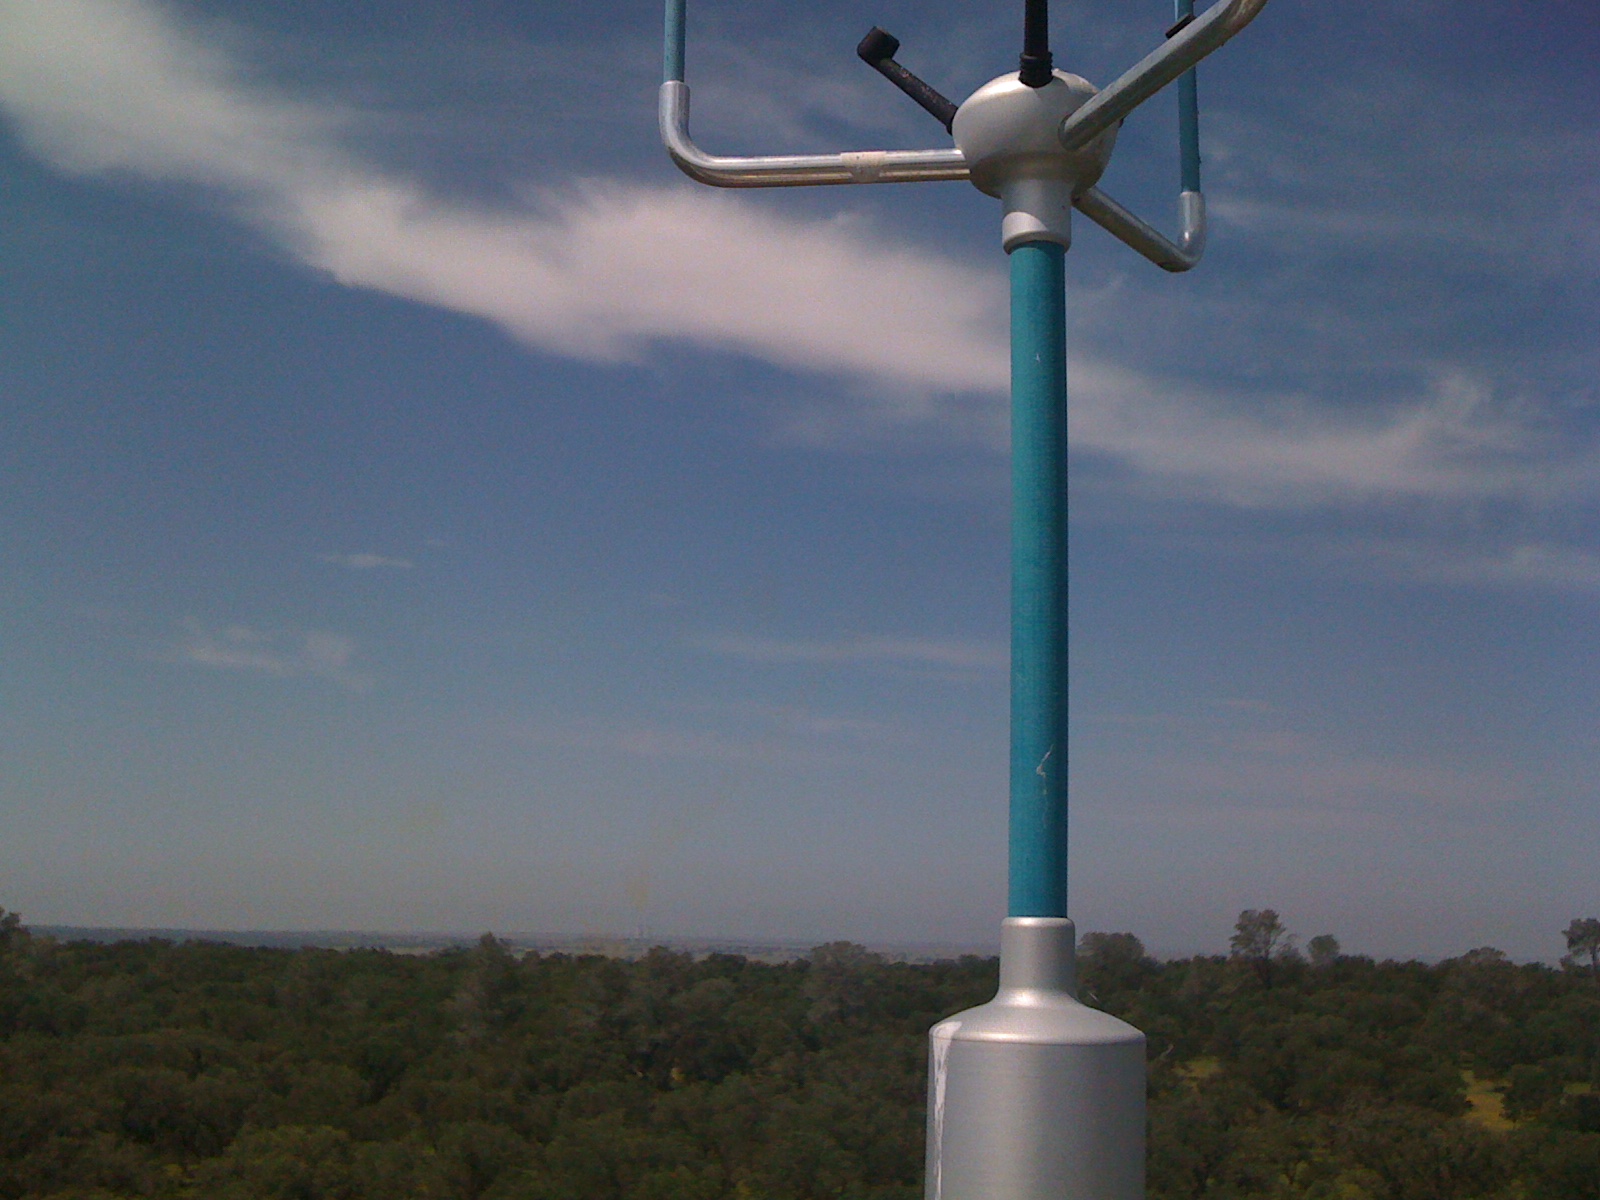
Sonic against sky at tower top
TZ_IMG_0490.jpg ( 2010-05-13 11:18:45 ) Full size: 1600x1200
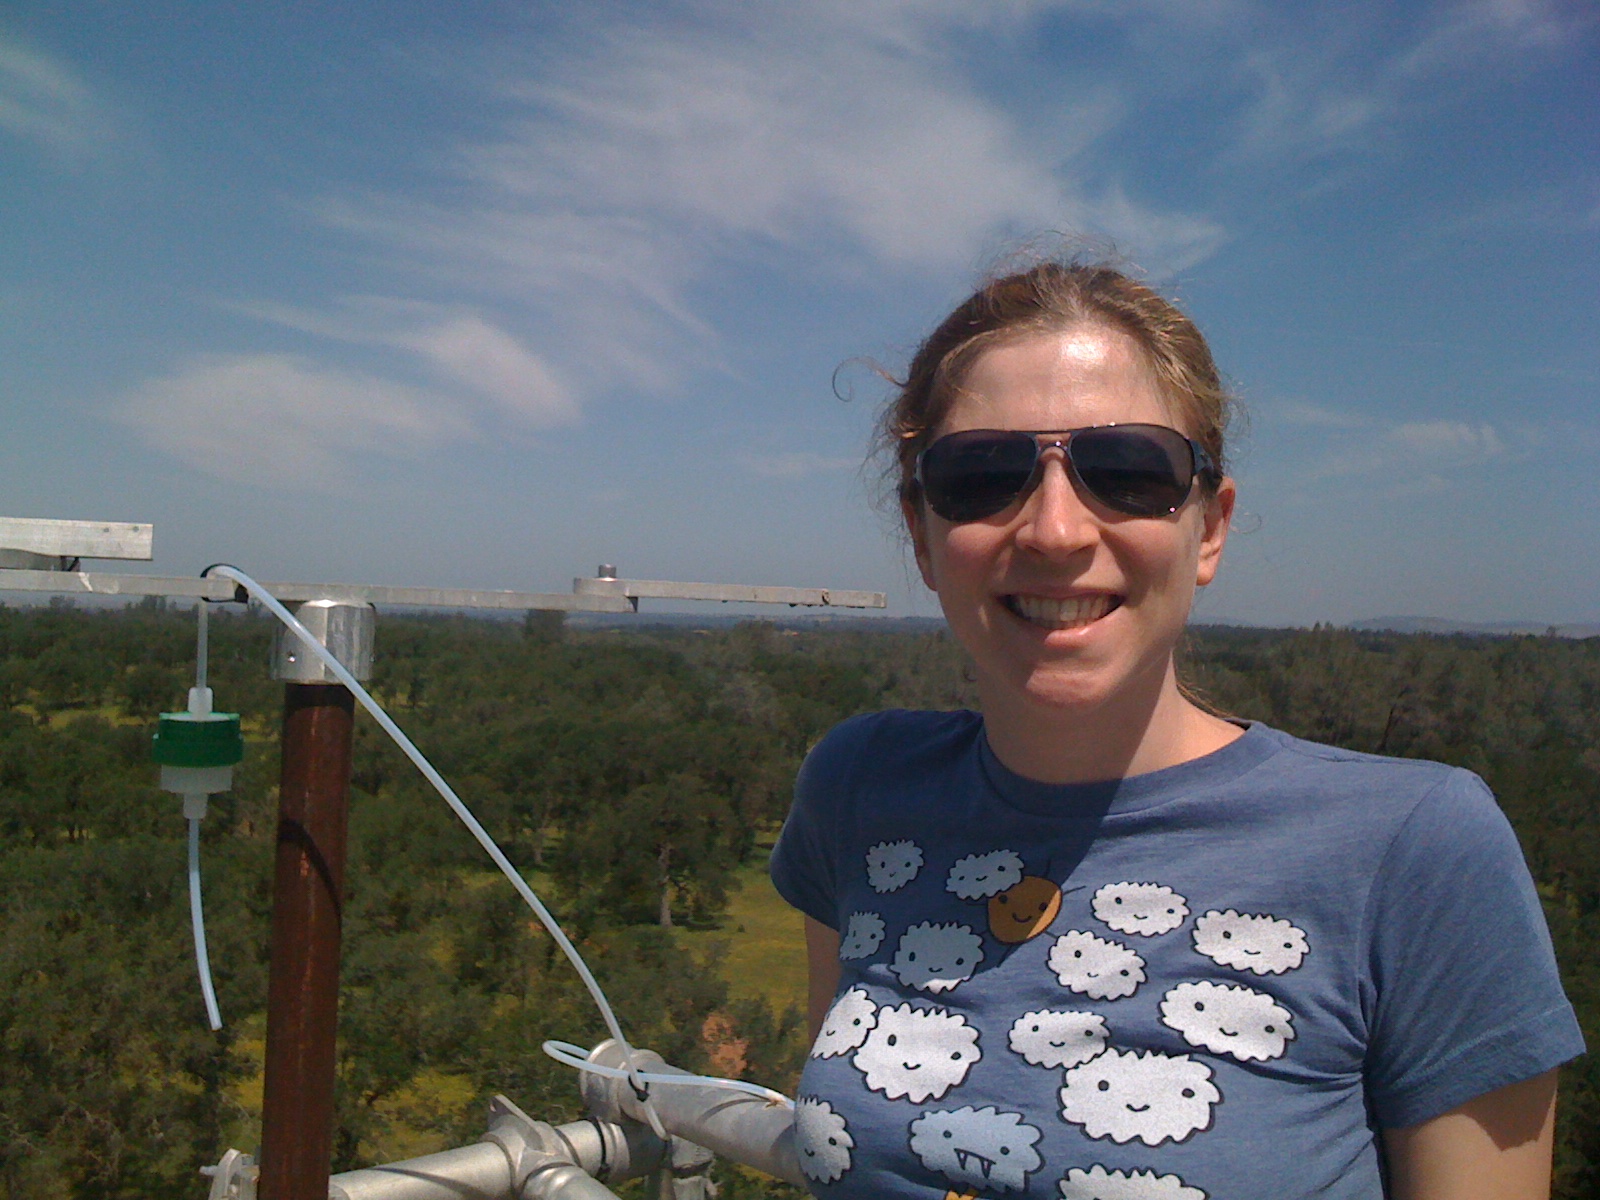
Melanie at Tonzi
TZ_IMG_0491.jpg ( 2010-05-13 12:59:34 ) Full size: 1600x1200
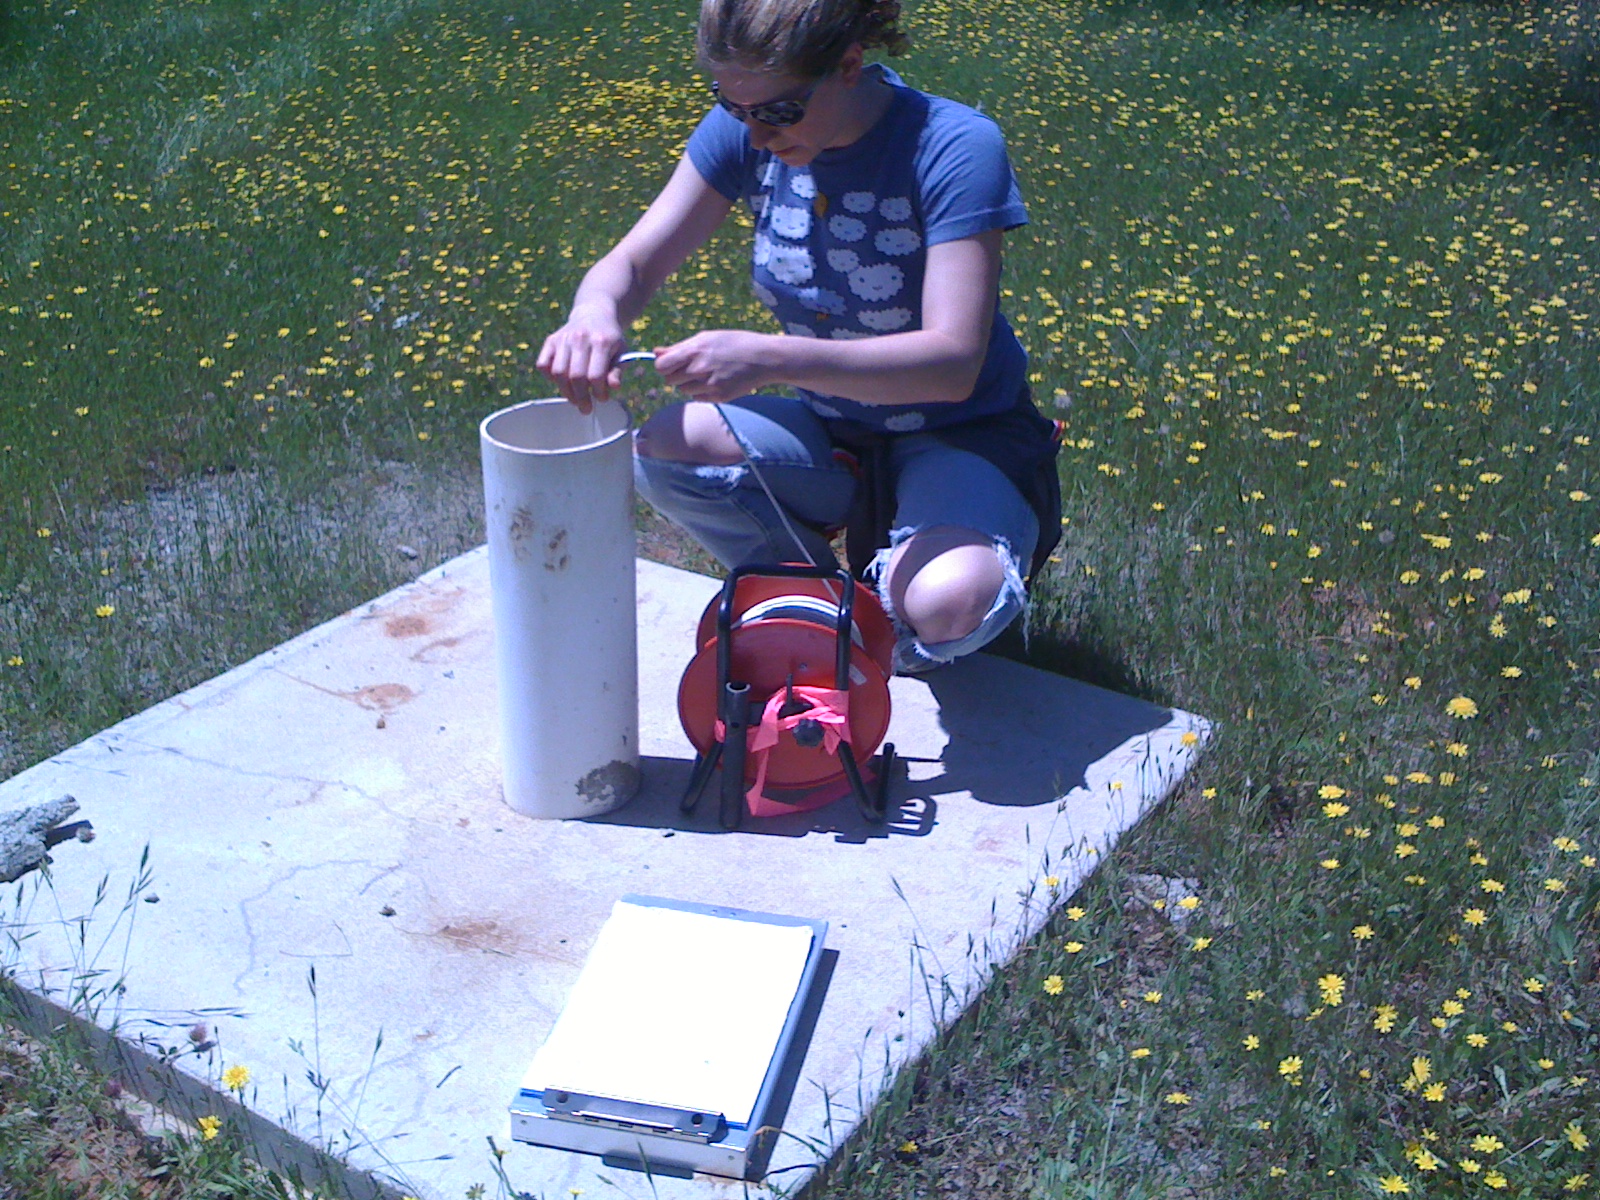
Melanie measuring well level
TZ_IMG_0492.jpg ( 2010-05-13 12:59:39 ) Full size: 1600x1200
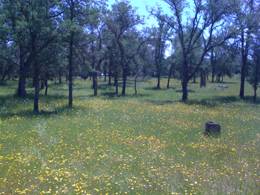
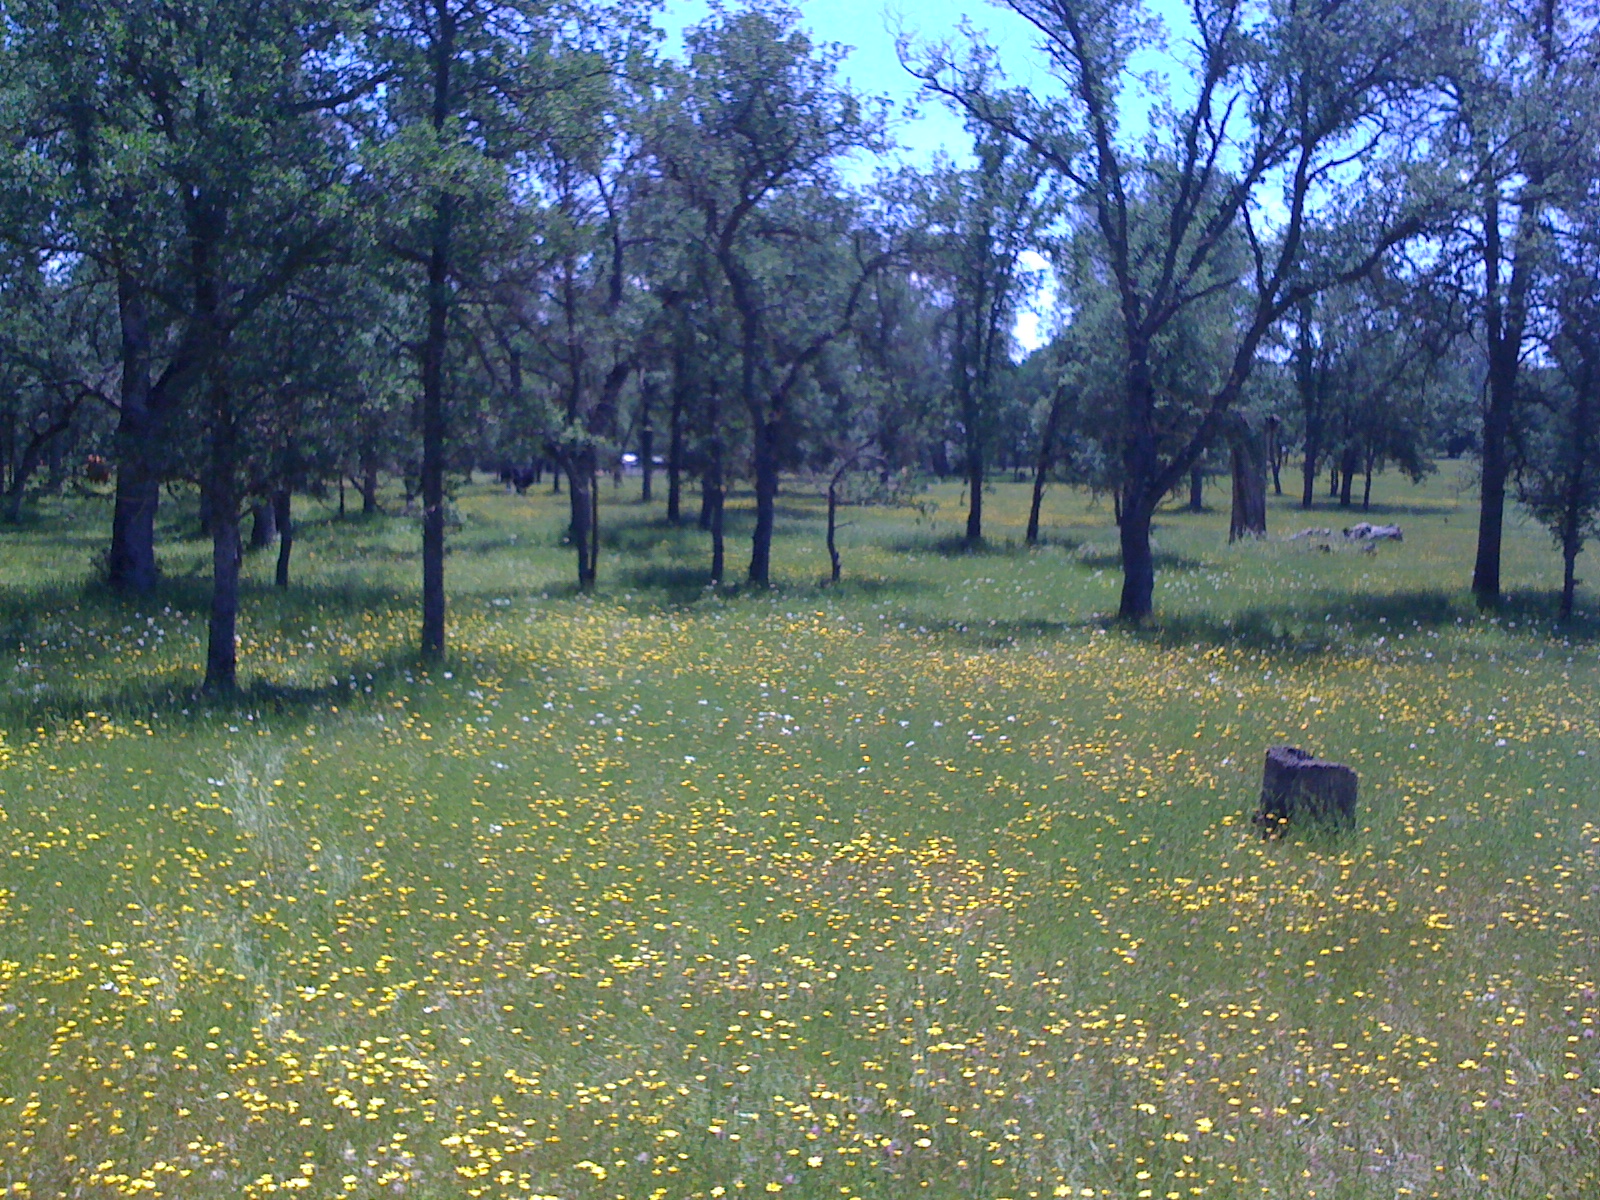
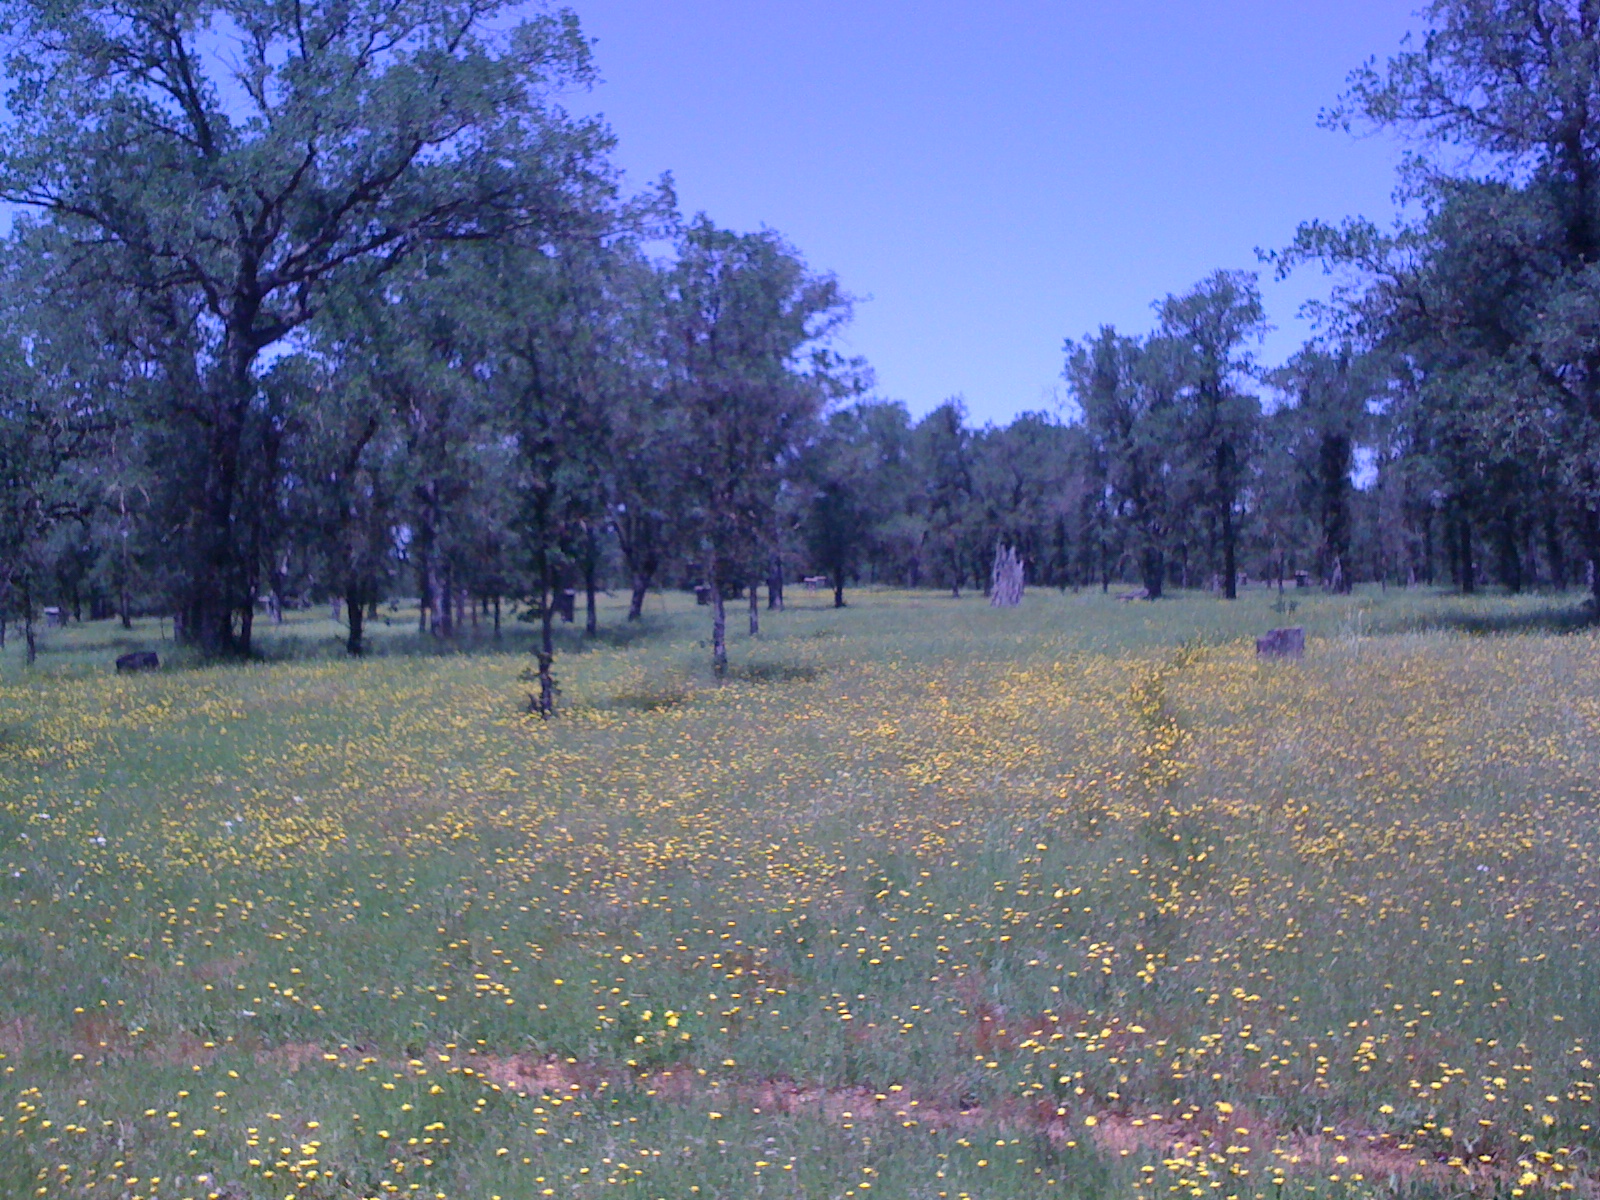
Wild flowers at the oak savanna
TZ_IMG_0493.jpg ( 2010-05-13 13:00:00 ) Full size: 1600x1200
Melanie measuring well level
TZ_IMG_0494.jpg ( 2010-05-13 13:00:06 ) Full size: 1600x1200
Wild flowers at the oak savanna
TZ_IMG_0495.jpg ( 2010-05-13 13:27:32 ) Full size: 1600x1200
Joe helping with Ameriflux inter-comparison
TZ_IMG_0496.jpg ( 2010-05-13 13:27:41 ) Full size: 1600x1200
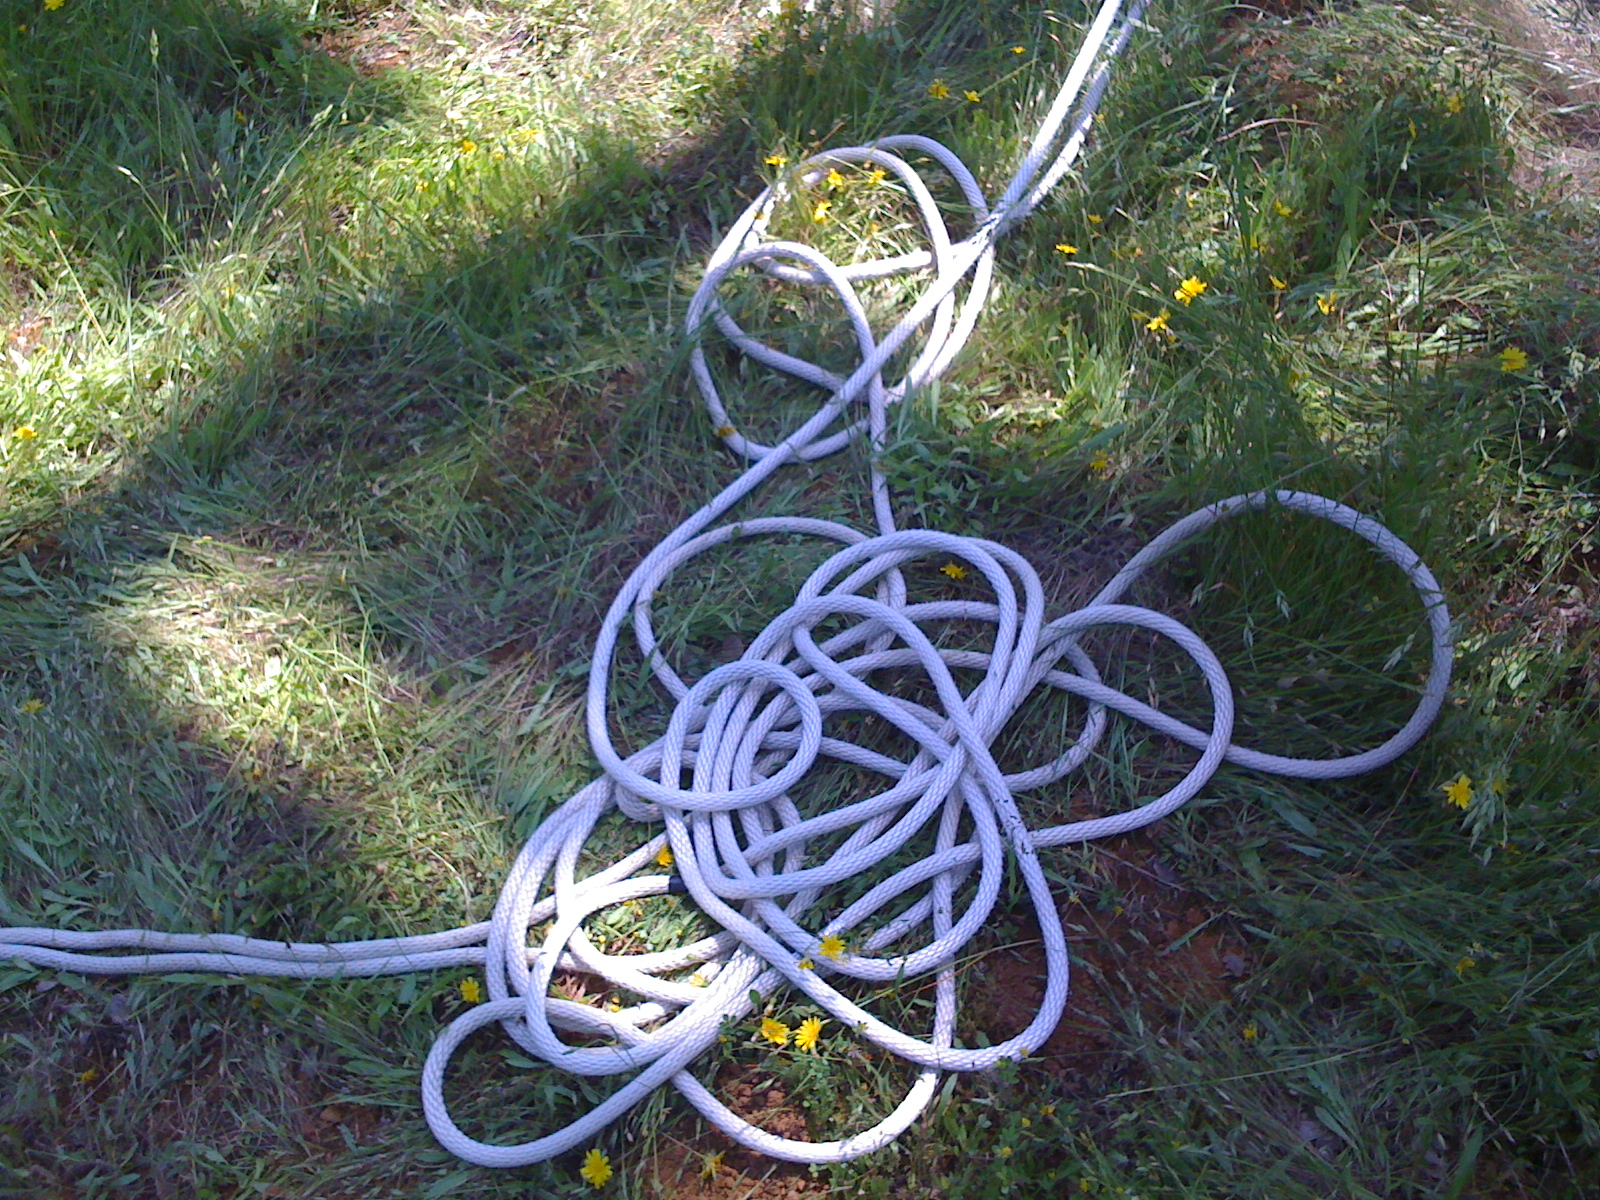
Rope coiled on the grass
16 sets found
No data found for TZ_Fenergy.
11 TZ_tmet graphs found
11 TZ_soilco2 graphs found
Can't check TZ_mixed
3 TZ_mixed graphs found
No data found for TZ_fflux.
8 TZ_fmet graphs found
1 TZ_tram graphs found
3 TZ_co2prof graphs found
No data found for TZ_irt.
No data found for TZ_windprof.
No data found for TZ_tflux.
2 TZ_sm graphs found
Can't check TZ_met
1 TZ_met graphs found
Can't check TZVR_mixed
No data found for TZ_osu.
No data found for TZ_fd.
Tonzi Z-cam data