Field Notes
<--2010-05-20 11:00:00 | 2010-06-03 11:30:00-->Other sites visited today: Vaira | Twitchell Rice | Tonzi
Phenocam link: Searching...
Sherman Island: 2010-05-28 08:00:00 (DOY 148)
Author: Joe Verfaillie
Others:
Summary: Pepper weed more in bloom, computer locked up, LI7700 installed.
| Sherman 5/28/2010 I arrived about 8:00am PDT. Cool and clear but warming quickly. A good wind from the west that would die and then shift to the north. The pepper weed at the cow pasture is more fully in bloom. There were puddles on the road from the rain in previous days, but the field was dry enough to drive on. Pepper weed inside cow fence is 122cm high, outside cow fence 56cm. At the Levee site I removed the LI7700 from the tower and changed the CR1000 program back to the previous levee version. I made measurements of the locations of the instruments: Sonic: Center is 698cm above ground LI7700: Bottom of path is 663cm, Top of path is 716cm, center is 690cm above ground and it was 23 cm south east of the sonic. LI7500: center is 698cm above ground and it is 25cm east of the sonic. Sonic heading is about 291 true based on landmarks visible in Google Earth. At the cow pasture the computer had locked up again. I swapped out the computer and set up a freshly formatted computer. I also fixed the serial line to the Soil CO2 data logger. I swapped the LI7500 with a freshly calibrated one. sn 0073 came off and sn 0041 went on. The LI7700 was installed. I cleaned the mirrors with rubbing alcohol and kim wipes bringing RSSI up to better than 80%. Instrument locations: Sonic: center 314cm above ground LI7500: center 277cm above ground and 28cm west of sonic LI7700: path bottom 282cm, path top 333cm, center 308cm above ground, 23cm SE of sonic. LGR inlet: 310cm above ground, 18cm east of sonic. Sonic heading is 13 true based on landmarks visible in Google Earth. Other instrument heights above ground: Diffuse PAR: 203cm CNR1 center: 260cm PAR Reflected: 239cm PAR Incoming: 259cm Net Radiation: 257cm LED NDVI: 257+-2cm Rain bucket: 259cm HMP45: 259cm I calibrated the LGR even though it was still very close. I also reset the LGR clock -2hours, +2 minutes. Last cal was on May 5, 2010 Initial: 11:40 -> 9:42PST, 25.11C, 126.38Torr, 17.11sec, 10Hz, 1.842ppm Pre Cal: 9:46PST, 156.4Torr, 1Hz, 1.973+-0.002ppm Post Cal: 1.976ppm High flow pressure adjust back to ~143Torr using by pass valve. CR1000 program was changed to add the LI7700 data as five single ended analog channels. Flash card was swapped before program change. Other data logger data collected. Need new washers for LI7500 mount. |
6 photos found
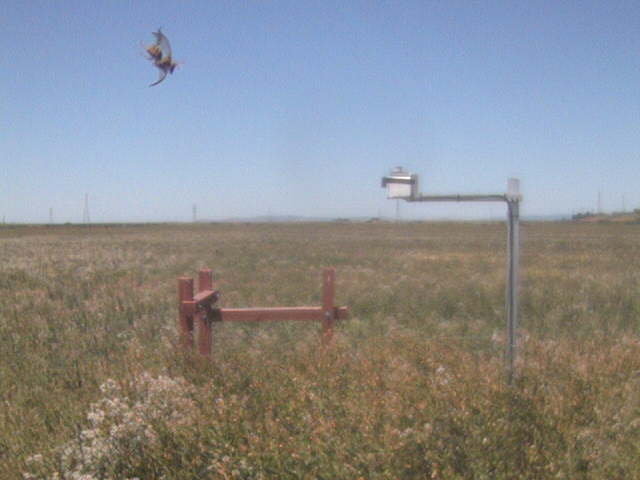
SI_webcam_20101491115.jpg ( 2010-05-29 11:15:02 ) Full size: 640x480
Wasp flying by.
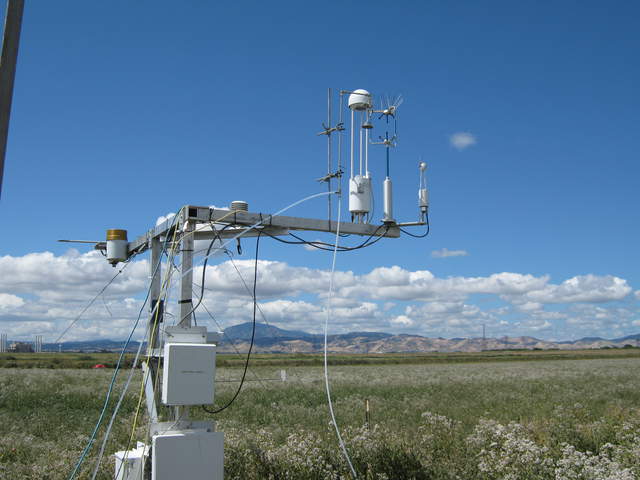
20100528SI_LI7700Tower1.jpg ( 2010-05-28 11:07:11 ) Full size: 3648x2736
Eddy tower with Mt Diablo and clouds in background
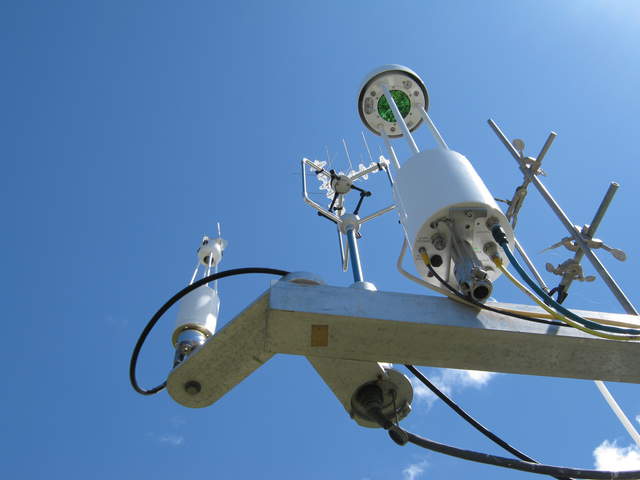
20100528SI_LI7700Tower2.jpg ( 2010-05-28 11:07:33 ) Full size: 3648x2736
Looking up at the eddy sensors
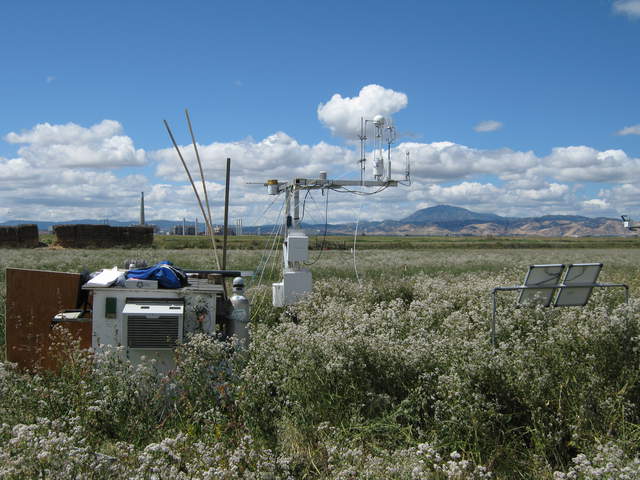
20100528SI_LI7700Tower3.jpg ( 2010-05-28 11:08:05 ) Full size: 3648x2736
View of the site with flowering pepper weed and Mt Diablo
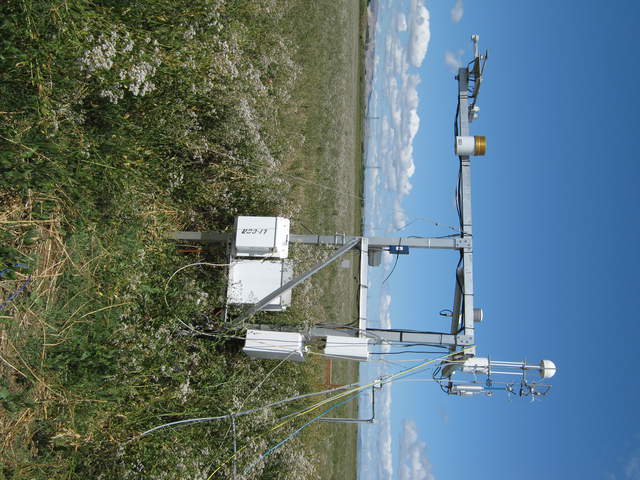
20100528SI_LI7700Tower4.jpg ( 2010-05-28 11:09:08 ) Full size: 3648x2736
View of the eddy tower
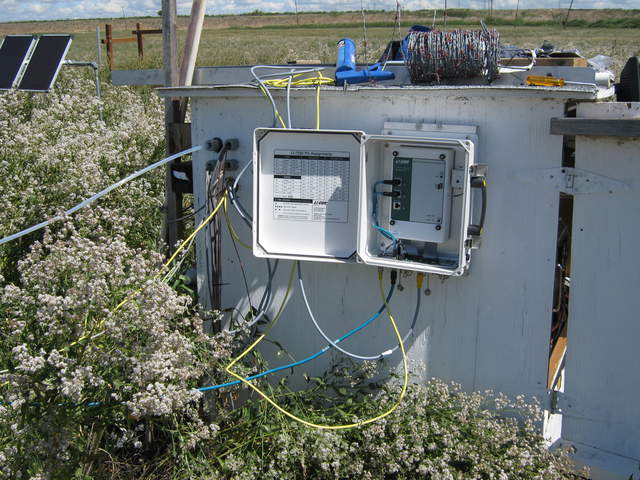
20100528SI_LI7550Box.jpg ( 2010-05-28 11:09:28 ) Full size: 3648x2736
LI-7550 box mounted on the equipment box.
7 sets found
No data found for SI_mp.
11 SI_met graphs found
Can't check SI_mixed
2 SI_mixed graphs found
No data found for SI_flx.
2 SI_soilco2 graphs found
Can't check TWSI_mixed
Can't check SIMBTWEE_met

