Field Notes
<--2010-05-28 05:10:00 |
2010-06-24 05:00:00-->
Phenocam link:
Searching...Tonzi: 2010-06-10 10:00:00 (DOY 161)
Author: Siyan Ma
Others: Dennis, Jaclyn
When: Date: 6/10/2010 ,
Day: 161 ,
Watch Time: 10:00 .
Where: Tonzi/Vaira Ranch
Who: Siyan, Dennis, Jacyln
Weather:
hot, nice breeze
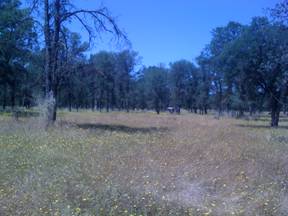
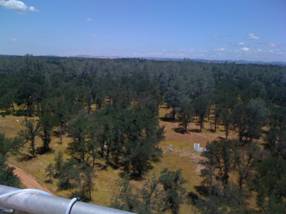
Phenology:
90% yellow grass at Vaira, 50% yellow grass at Tonzi, green oak leaves
Summary
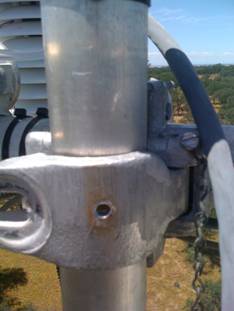
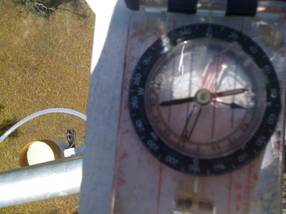
- check the direction of the “N” bar of the sonic anemometer
Tonzi - Sonic: 70 degree W from Meg north;
Vaira – Sonic: 0 degree from Meg. North
- check and download data at Tower, Floor, and Vaira
- calibrate Li-800 in the field because bump was dead.
- collected samples of dry grasses, green grasses, oak leaves and
pin needles
- dendrometers
- soil moisture
- groundwater well:
Date
|
DOY
|
Location
|
Depth
from the black thing (feet)
|
6/10/2010
|
161
|
Floor
|
20.43
|
|
|
Tower
|
24.5
|
|
|
roadside
|
29.675
|
Vaira_Grass
Site
- Fence and gate power: 12
v.
- Panel and Batteries: 13.4 v; 13.3 amps; 2.4
amps.
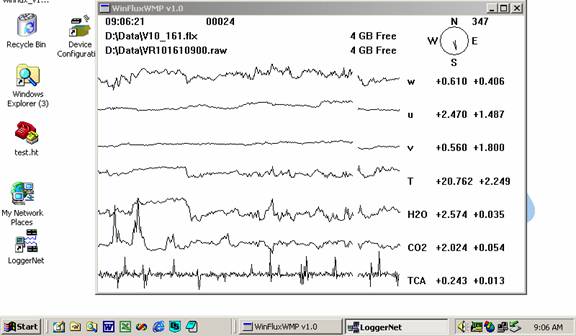
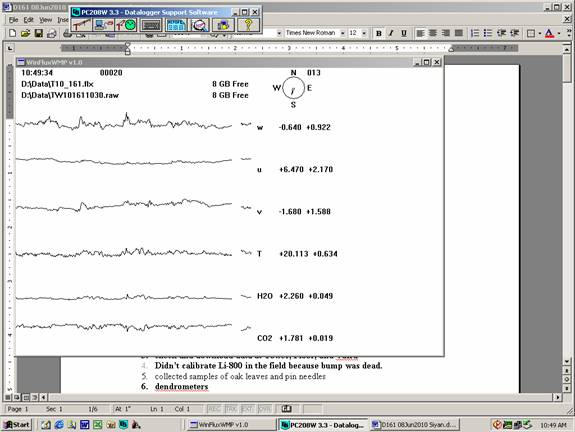
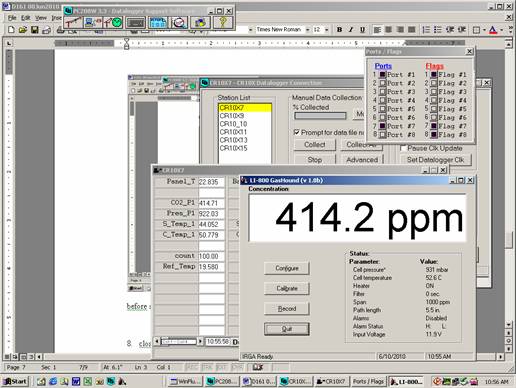
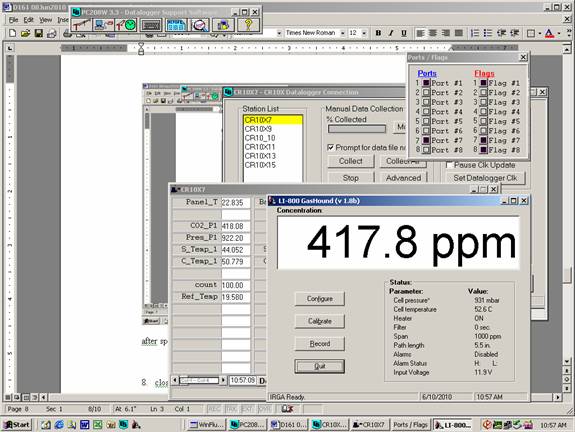
- Reading from Gillsonic screen
before downloading data. (The value
of H2O and CO2 should be in the range of 0 – 5 v.)
Vaira computer clock: 3
min faster than cell phone’s 9.21 am
– fixed at ~9:34 am
- downloading data YES!
- Check the fans of air temp.
and relative humidity sensors at Vaira. YES!
- Check MD-9 system connections
YES!
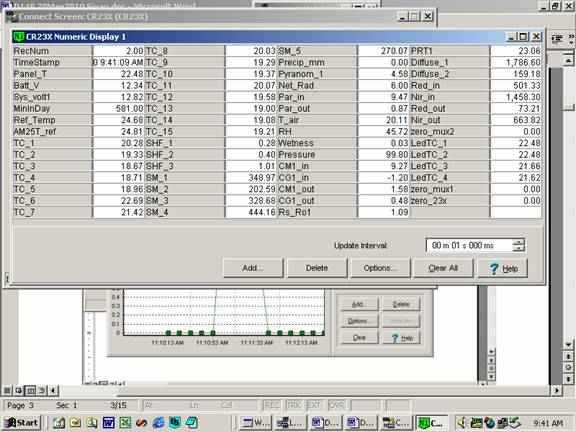
- Check CR23X with two
multiplexers
- Check levels of Radiation
sensors, clear up surfaces.YES!
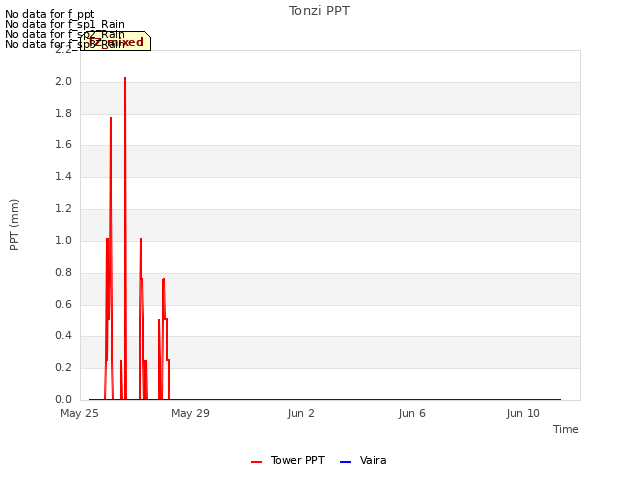
- Check rain gage, make sure
not clogged. YES!
Dennis Baldocchi to Joseph, Siyan
show details Jun 11 (4 days ago)
Joe
Siyan and I tried to debug the rain gauge problem.
1. I inspected the sensor and it was clean and ok.
2. checked wires and connections and they seemed ok..Wire
went to P1..as it
is a pulse counting sensor
3. Tipped the sensor multiple times and Siyan was able to
read it on the
datalogger..
4. We saw NO counts for the 30 min reading..
5. Checked program and it seems ok..The input was P1 and
the output was
location 30
It read like the example in the manual (though for a
CR10x)
1: Pulse (P3)
1: 1 Reps
2: 1 Pulse Channel 1
3: 2 Switch Closure, All Counts
4: 30 Loc [ Rain_mm ]
5: 0.254 Multiplier
6: 0 Offset
The 30 value is totalized:
5: Totalize (P72)
1: 1 Reps
2: 30 Loc [ Rain_mm ]
So at this point not sure what else to say or do Or know
why it quit
working and giving spurious data..
|
- Closed gate and set up fence.
YES!
Tonzi_Tower Site
- Fence and gate power: 12 v.
- Panel and Batteries: 12.7
v; 0.0
amps; 5.6
amps.
- Reading from Gillsonic screen
before downloading data. (The value
of H2O and CO2 should be in the range of 0 – 5 v.)
- downloading data YES!
- check the fans of air temp.
and relative humidity sensors on the tower and the floor. YES!
- Check rain gage, make sure
not clogged. YES!
- Check calibration cylinders;
CO 2 500 psig; flow 20 psi; 418.8
ppm.
N 2 2000
psig; flow 20 psi.
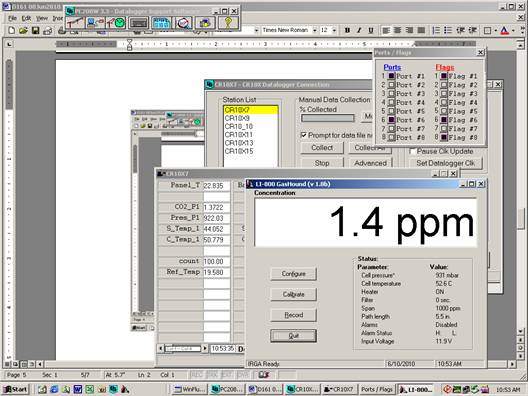
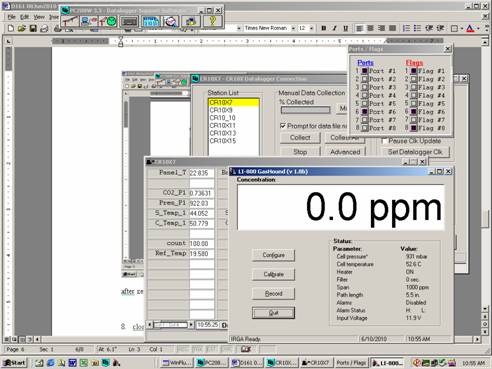
Manually calibrate Li-800. Following Ted’s instruction: H:\IoneSavanna_2004\Tower_2004\CO2Profile\LI800_Calibration_Procedure_2Nov04.txt
Is the pump running YES.
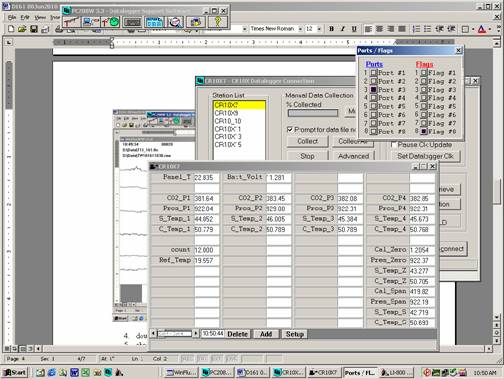
before zero
after zero
before span
after span
- close gate and set up fence. YES!
Toniz_Floor
Site
- Fence and gate power: 12
v.
- Panel and Batteries: -
v; -
amps; -
amps. (about
7:00 am local time)
- Reading from Gillsonic screen
before downloading data. (The value
of H2O and CO2 should be in the range of 0 – 5 v.)
- downloading data YES!
- Check MD-9 system
connections YES!
CR23X3 – floor-Met
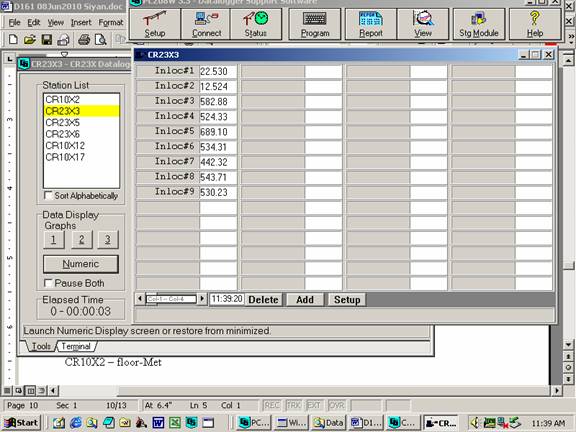
CR23X5 – soil CO 2
profile
No connection. Dennis fixed it but
lost it again.
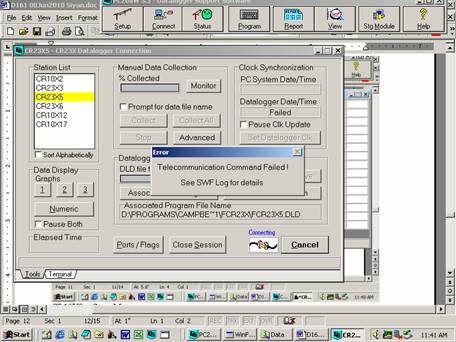
CR23X6 – tower-Met
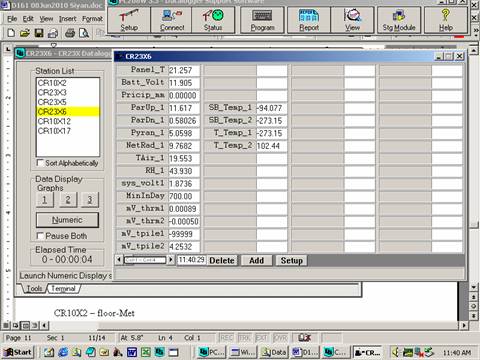
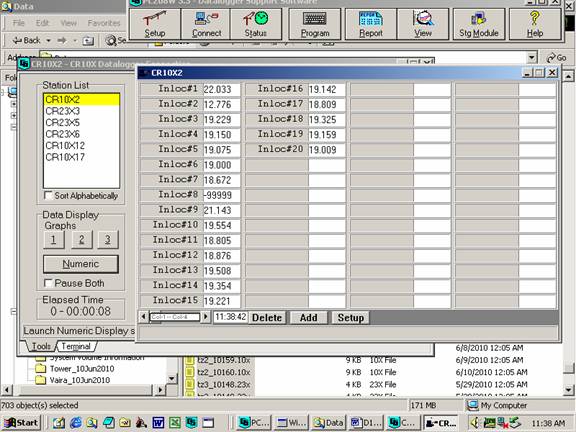
CR10X2 – floor-Met
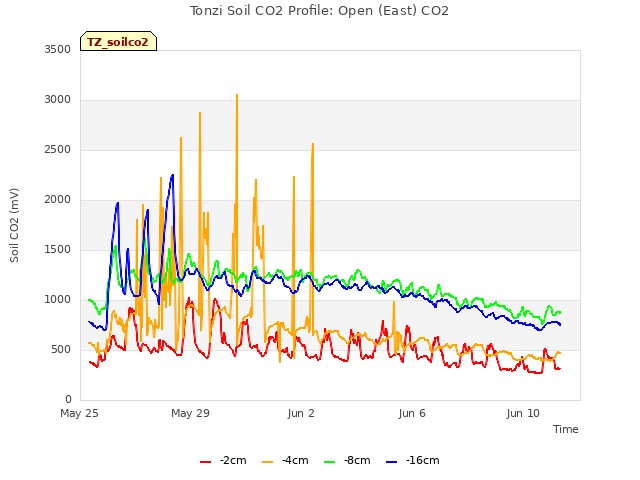
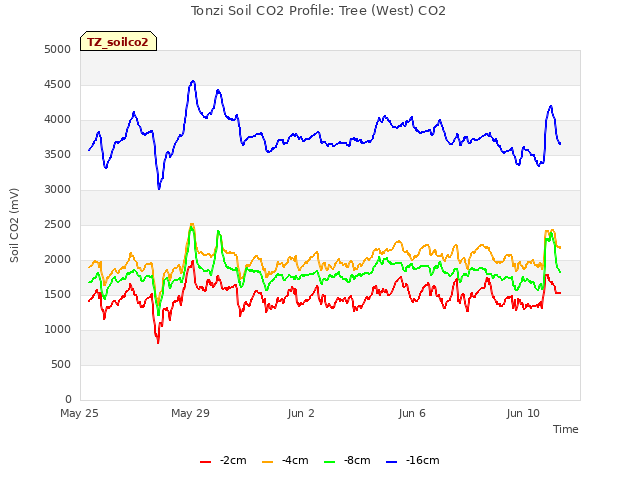
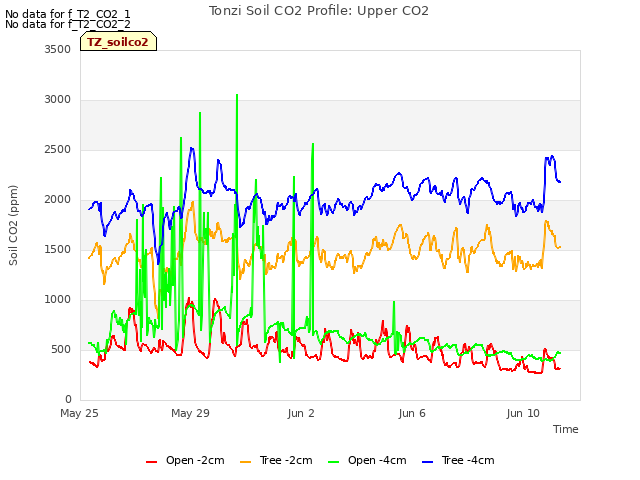
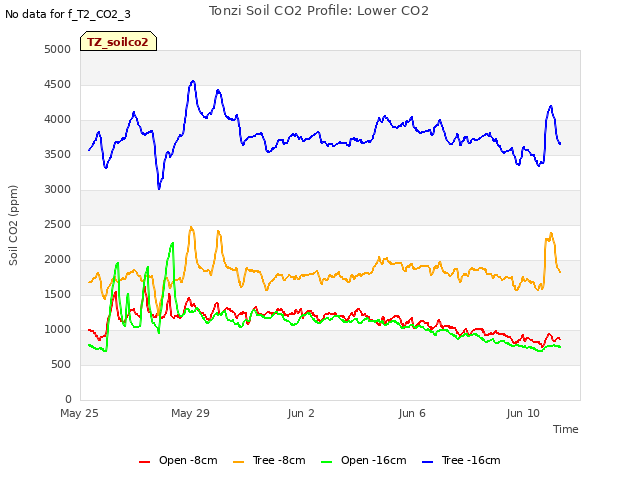
- Soil CO2 profile:
no power when I got there. I unplug
and re-plug fuses, then the system back to work.
Reading
from datalogger
Reading
from panels of analyzers
depth
|
Open
|
order
|
depth
|
Tree
|
order
|
2cm
(1%)
|
970
|
1
|
2cm
(1%)
|
3620
|
1
|
4cm
|
830
|
2
|
4cm
|
4910
|
4
|
8cm
|
1800
|
3
|
8cm
|
4690
|
2
|
16cm
|
1550
|
4
|
16cm
|
8190
|
3
|
- Close gate and set up fence. YES!
tonzi
|
7931AFE
|
402165
|
574B4B
|
402FF3
|
574632
|
7A432E
|
7A3C6E
|
7A3B40
|
7A4AAA
|
6/10/2010
|
161
|
|
|
|
|
|
|
|
|
|
sm
|
|
|
|
|
|
|
|
|
0-15
|
8.8
|
6.1
|
#DIV/0!
|
8.1
|
13.1
|
6.0
|
11.5
|
8.7
|
5.5
|
15-30
|
15.3
|
13.2
|
23.9
|
14.7
|
14.4
|
11.5
|
16.4
|
15.6
|
6.1
|
30-45
|
20.9
|
16.1
|
34.0
|
18.3
|
11.6
|
12.3
|
17.0
|
19.6
|
17.9
|
45-60
|
21.5
|
13.4
|
32.9
|
21.2
|
27.3
|
15.9
|
17.7
|
29.3
|
14.3
|
|
|
|
|
|
|
|
|
|
|
|
A6D882B
|
A3D04E8
|
A6D72F5
|
|
|
|
|
|
|
|
|
|
|
|
|
|
|
|
|
0-15
|
11.5
|
5.0
|
5.2
|
|
|
|
|
|
|
15-30
|
12.9
|
2.3
|
17.8
|
|
|
|
|
|
|
30-45
|
19.8
|
18.4
|
20.9
|
|
|
|
|
|
|
45-60
|
21.3
|
26.1
|
21.9
|
|
|
|
|
|
|
|
|
|
|
|
|
|
|
|
|
vaira
|
57318a
|
7933dee
|
|
|
|
|
|
|
|
0-15
|
1.9
|
4.4
|
|
|
|
|
|
|
|
15-30
|
12.9
|
12.8
|
|
|
|
|
|
|
|
30-45
|
12.4
|
16.7
|
|
|
|
|
|
|
|
45-60
|
broken
|
27.9
|
|
|
|
|
|
|
|
Emails from Dennis about this trip:
Dennis Baldocchi to Joseph, Jaclyn, Matteo, Siyan
show details Jun 11 (4 days ago)
Joe
After 10 years we have a few moisture point probes that
are giving us fits
and need to be pulled and sent to the manufacture for
repair while are
grants are still in action.
There are 2 or so at Sherman
Island..I have asked Jaclyn to
pull those next
time.
There is also a problem with the probe at Vaira..the one
between the solar
panel and the radiation station. One of the pins was bent..and looks like
it had been bent repeatedly..I tried to put it back in
position but the
metal as so weak by this stage it broke. It seems it only affects the
measurements at the 45-60 cm range....as all readings were
41.9%%...Something we see also at Sherman
for mal functioning sensors...
So we should pull this one next time too and send it back
with the others
for repair..
Thanks
Dennis Baldocchi
Professor of Biometeorology
Department of Environmental Science, Policy and Management
& Berkeley Atmospheric Science
Center
137 Mulford Hall (mail)
345 Hilgard Hall (office)
University of California,
Berkeley
Berkeley, CA
ph: 510 642 2874
Fax: (510) 643-5438
email: baldocchi@berkeley.edu
web: nature.berkeley.edu/biometlab
|
Tonzi
|
|
|
|
|
|
Dendrometer
|
|
|
|
|
|
|
|
|
|
|
Date
|
Day
|
Tag #
|
Reading (mm)
|
|
|
6/10/2010
|
161
|
72
|
11.1
|
|
|
|
|
79
|
15.8
|
|
|
|
|
245
|
12.9
|
|
|
|
|
250
|
21.9
|
(reset to 10.5 on May 7, 2009)
|
|
|
|
102
|
X
|
|
|
|
|
1
|
20.9
|
|
|
|
|
2
|
11
|
|
|
|
|
3
|
18.3
|
|
|
|
|
4
|
9.6
|
|
|
|
|
5
|
13.1
|
|
|
|
|
7
|
16.8
|
133
|
|
|
|
8
|
16.9
|
11828
|
|
|
|
71
|
X
|
|
|
|
|
77
|
X
|
|
|
|
|
78
|
X
|
|
|
|
|
248
|
X
|
broken
|
|
|
|
255
|
X
|
|
|
|
|
252
|
X
|
|
|
|
|
6
|
X
|
|
|
Notes:
“X” means not working any more.
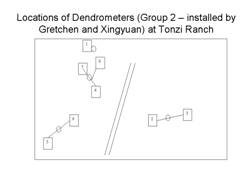
Dendrometers
installed by Gretchen group
|
Field Data
No tank data
Well Depth
| Date | Location | Depth (feet) |
|---|
| 2010-06-10 | TZ_floor | 20.43 |
| 2010-06-10 | TZ_road | 29.68 |
| 2010-06-10 | TZ_tower | 24.5 |
No TZ Moisture Point data found
No VR Moisture Point data found
No TZ grass heigth found
No VR grass heigth found
No TZ Tree DBH found
No water potential data found
No TZ Grass Biomass data found
No TZ OakLeaves Biomass data found
No TZ PineNeedles Biomass data found
0 photos found
16 sets found
No data found for TZ_Fenergy.
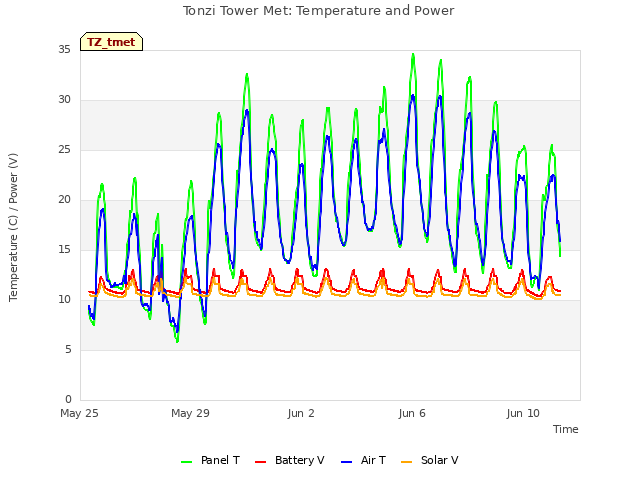
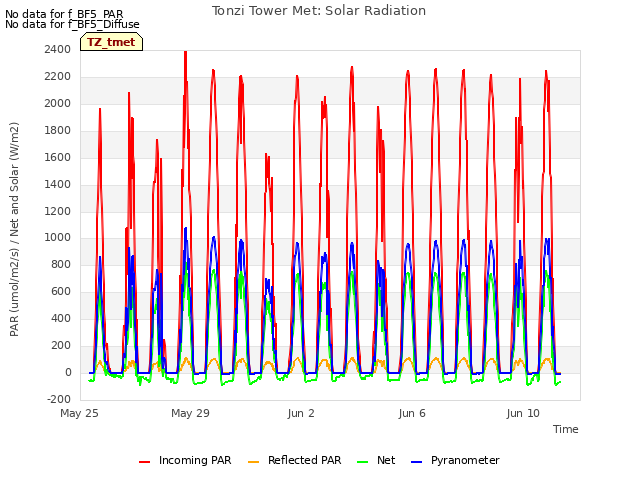
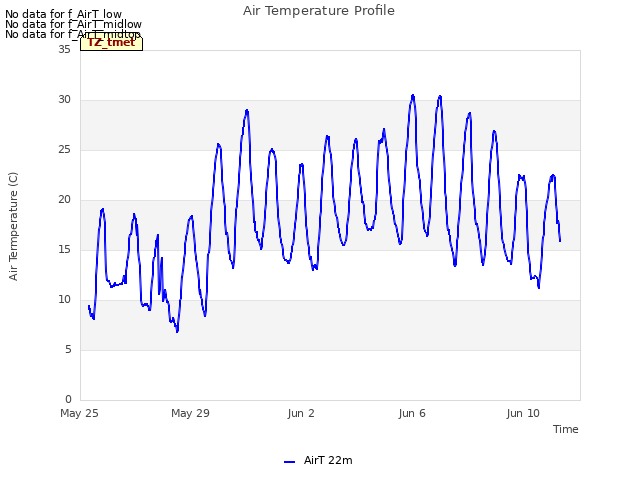
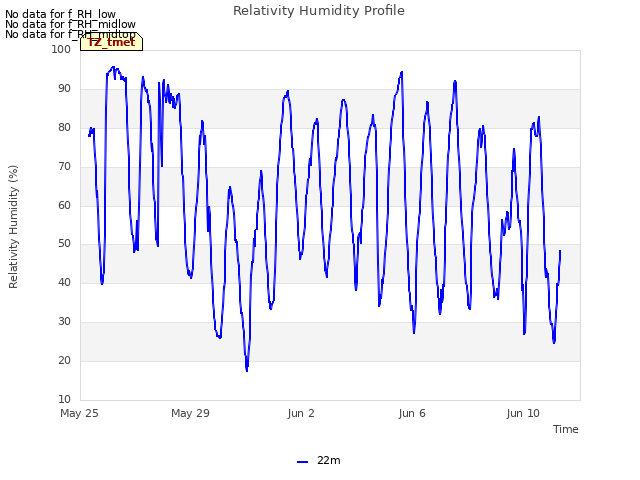
11 TZ_tmet graphs found


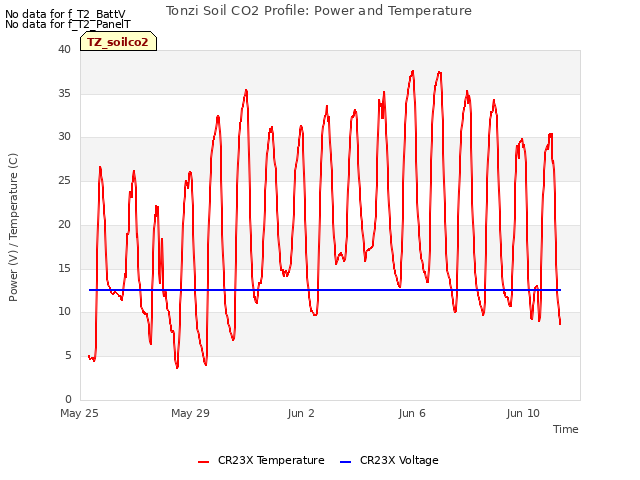
11 TZ_soilco2 graphs found


Can't check TZ_mixed
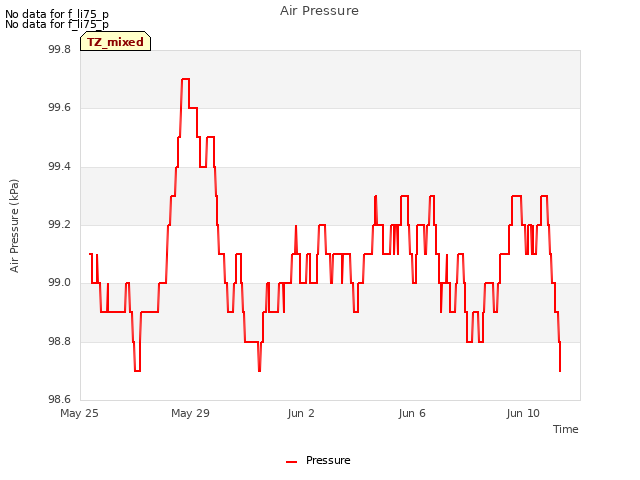
3 TZ_mixed graphs found

No data found for TZ_fflux.
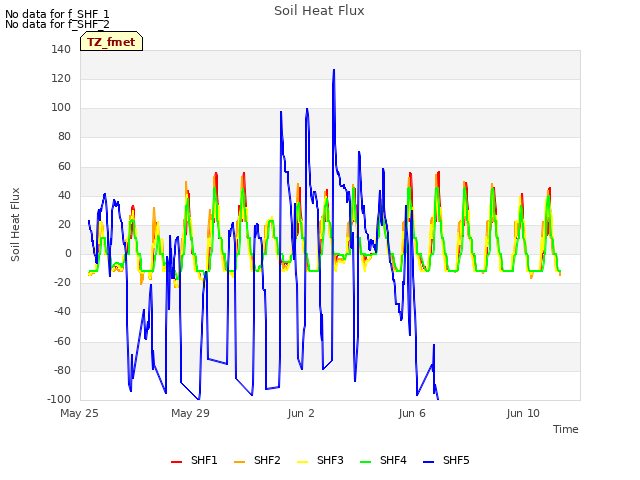
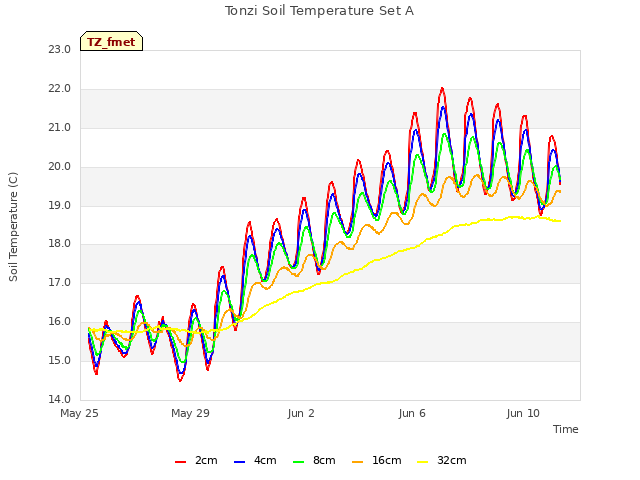
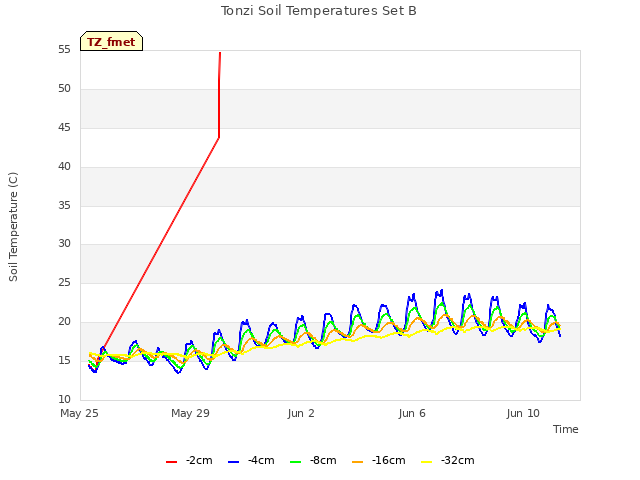
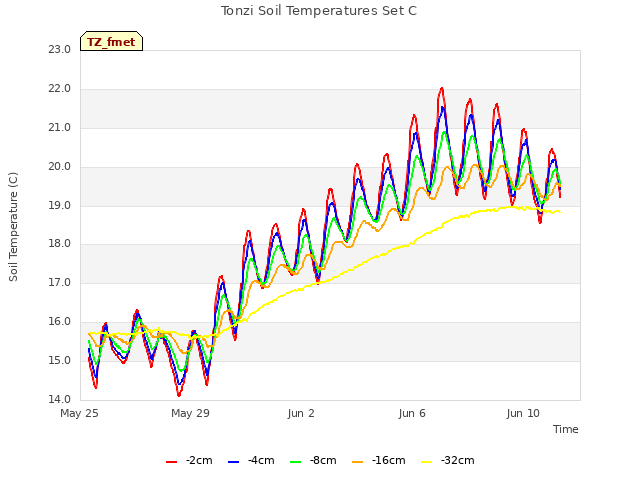
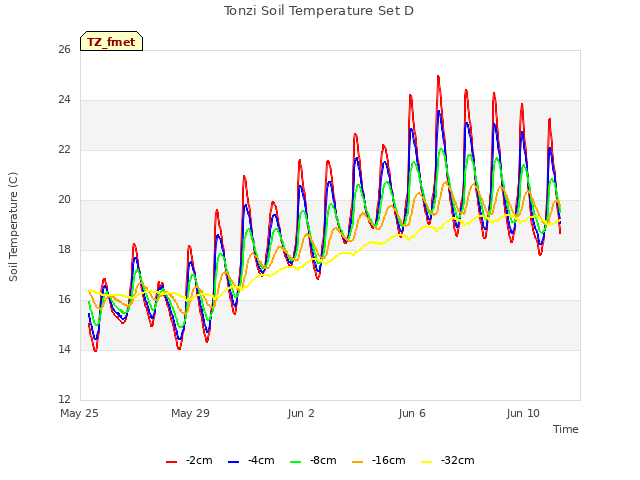
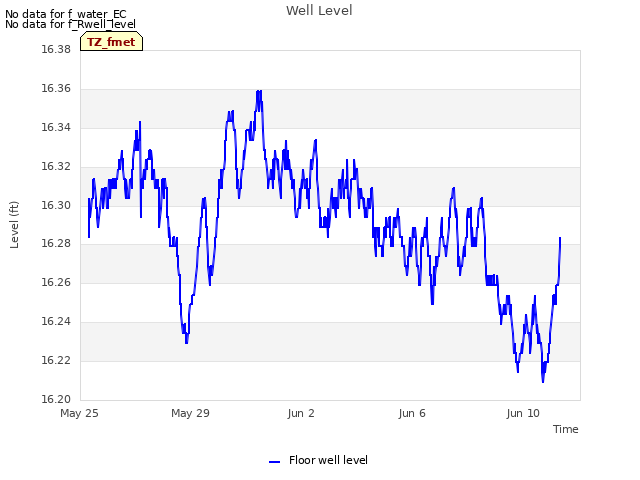
8 TZ_fmet graphs found


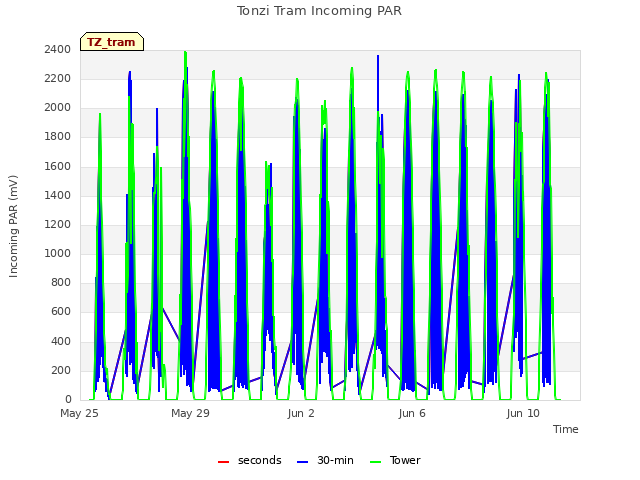
1 TZ_tram graphs found
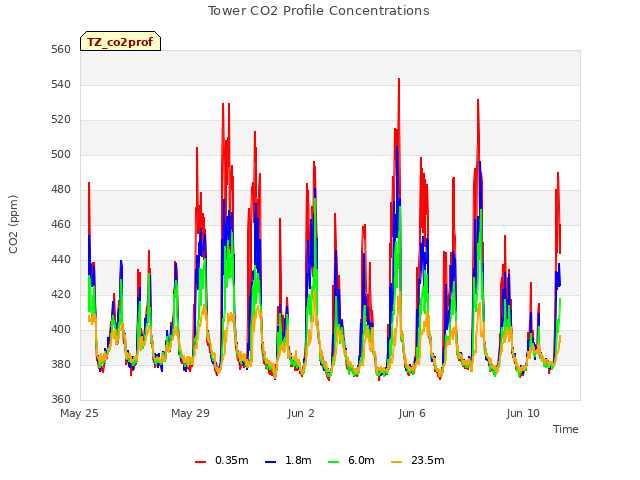
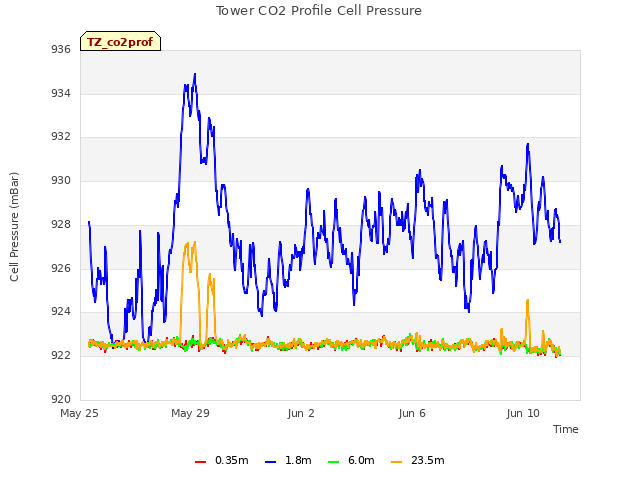
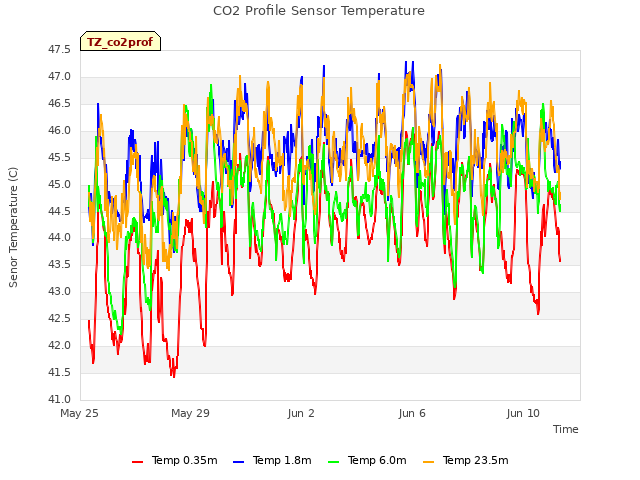
3 TZ_co2prof graphs found
No data found for TZ_irt.
No data found for TZ_windprof.
No data found for TZ_tflux.
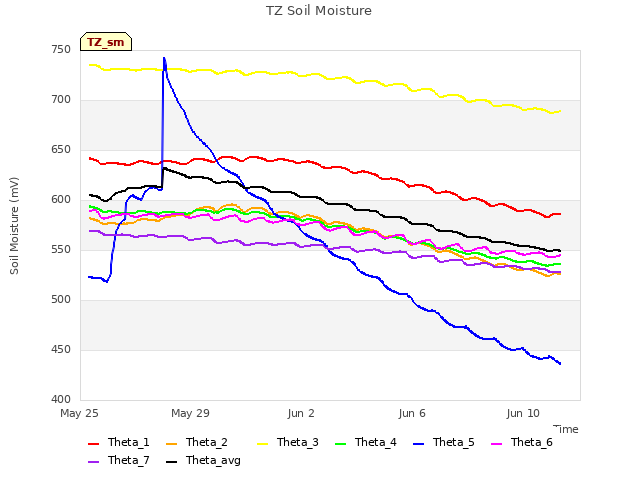
2 TZ_sm graphs found

Can't check TZ_met
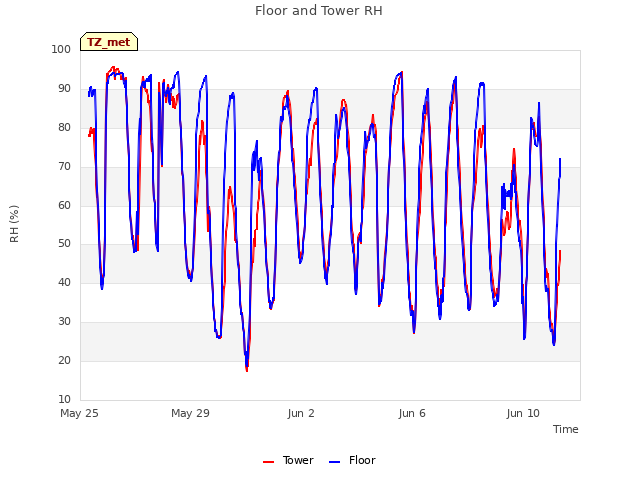
1 TZ_met graphs found
Can't check TZVR_mixed
No data found for TZ_osu.
No data found for TZ_fd.
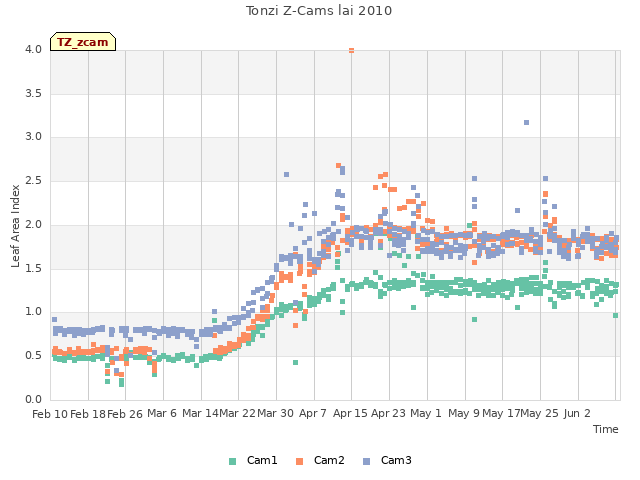
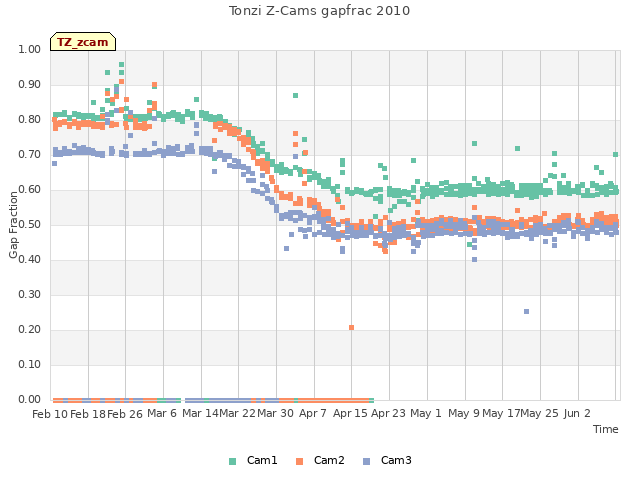
Tonzi Z-cam data