
Field Notes
<--2023-04-26 17:30:00 | 2023-05-09 12:25:00-->Other sites visited today: Gilbert Tract | East End | Hill Slough
Phenocam link: Searching...
Bouldin Corn: 2023-05-03 15:15:00 (DOY 123)
Author: Daphne Szutu
Others: Joe
Summary: Installed soil sensors under tower, water level sensor pulled out--fixed, field tilled but not yet planted
| 2023-05-03 Bouldin Corn Joe and I arrived around 15:15 PDT. It was overcast and drizzly with an occasional cool gust. Our field has been disked but it doesn't look like it's been planted. This was a maintenance trip to install the soil sensors that Joe, Sophie, and Megan pulled out last week. All of the thermocouple profiles had some loose thermocouples. We retaped the thermocouples at -2, -4, -8, -16, and -32 cm depths. We installed all three Campbell soil profiles under the tower. The top of the VWC sensors were installed vertically with the top of the sensor 5cm below the soil surface. Sensors moved: sn 17128 sn 17129 sn 17133 The soil heat flux plates were installed 2cm below the soil surface. Sensors installed: sn 10861 sn 10867 sn 11326 I checked the met data and noticed that the water level sensor had been pulled out of the datalogger. Joe and I re-wired it and confirmed that the numbers were reasonable. The sensor was annoying to rewire because there's not much slack and one of the wires is much shorter than the other; unfortunately it's not easy to extend this cable because of the atmospheric pressure vent. This whole box could be re-wired with an expanded pluggable power strip. The 7500 read: 406ppm CO2, 447mmol/m3 H2O, 15.6C, 100.9kPa, 100SS The 7700 read: 2.04ppm CH4, 34RSSI—forgot to clean We left at 16:05 PDT. |
2 photos found
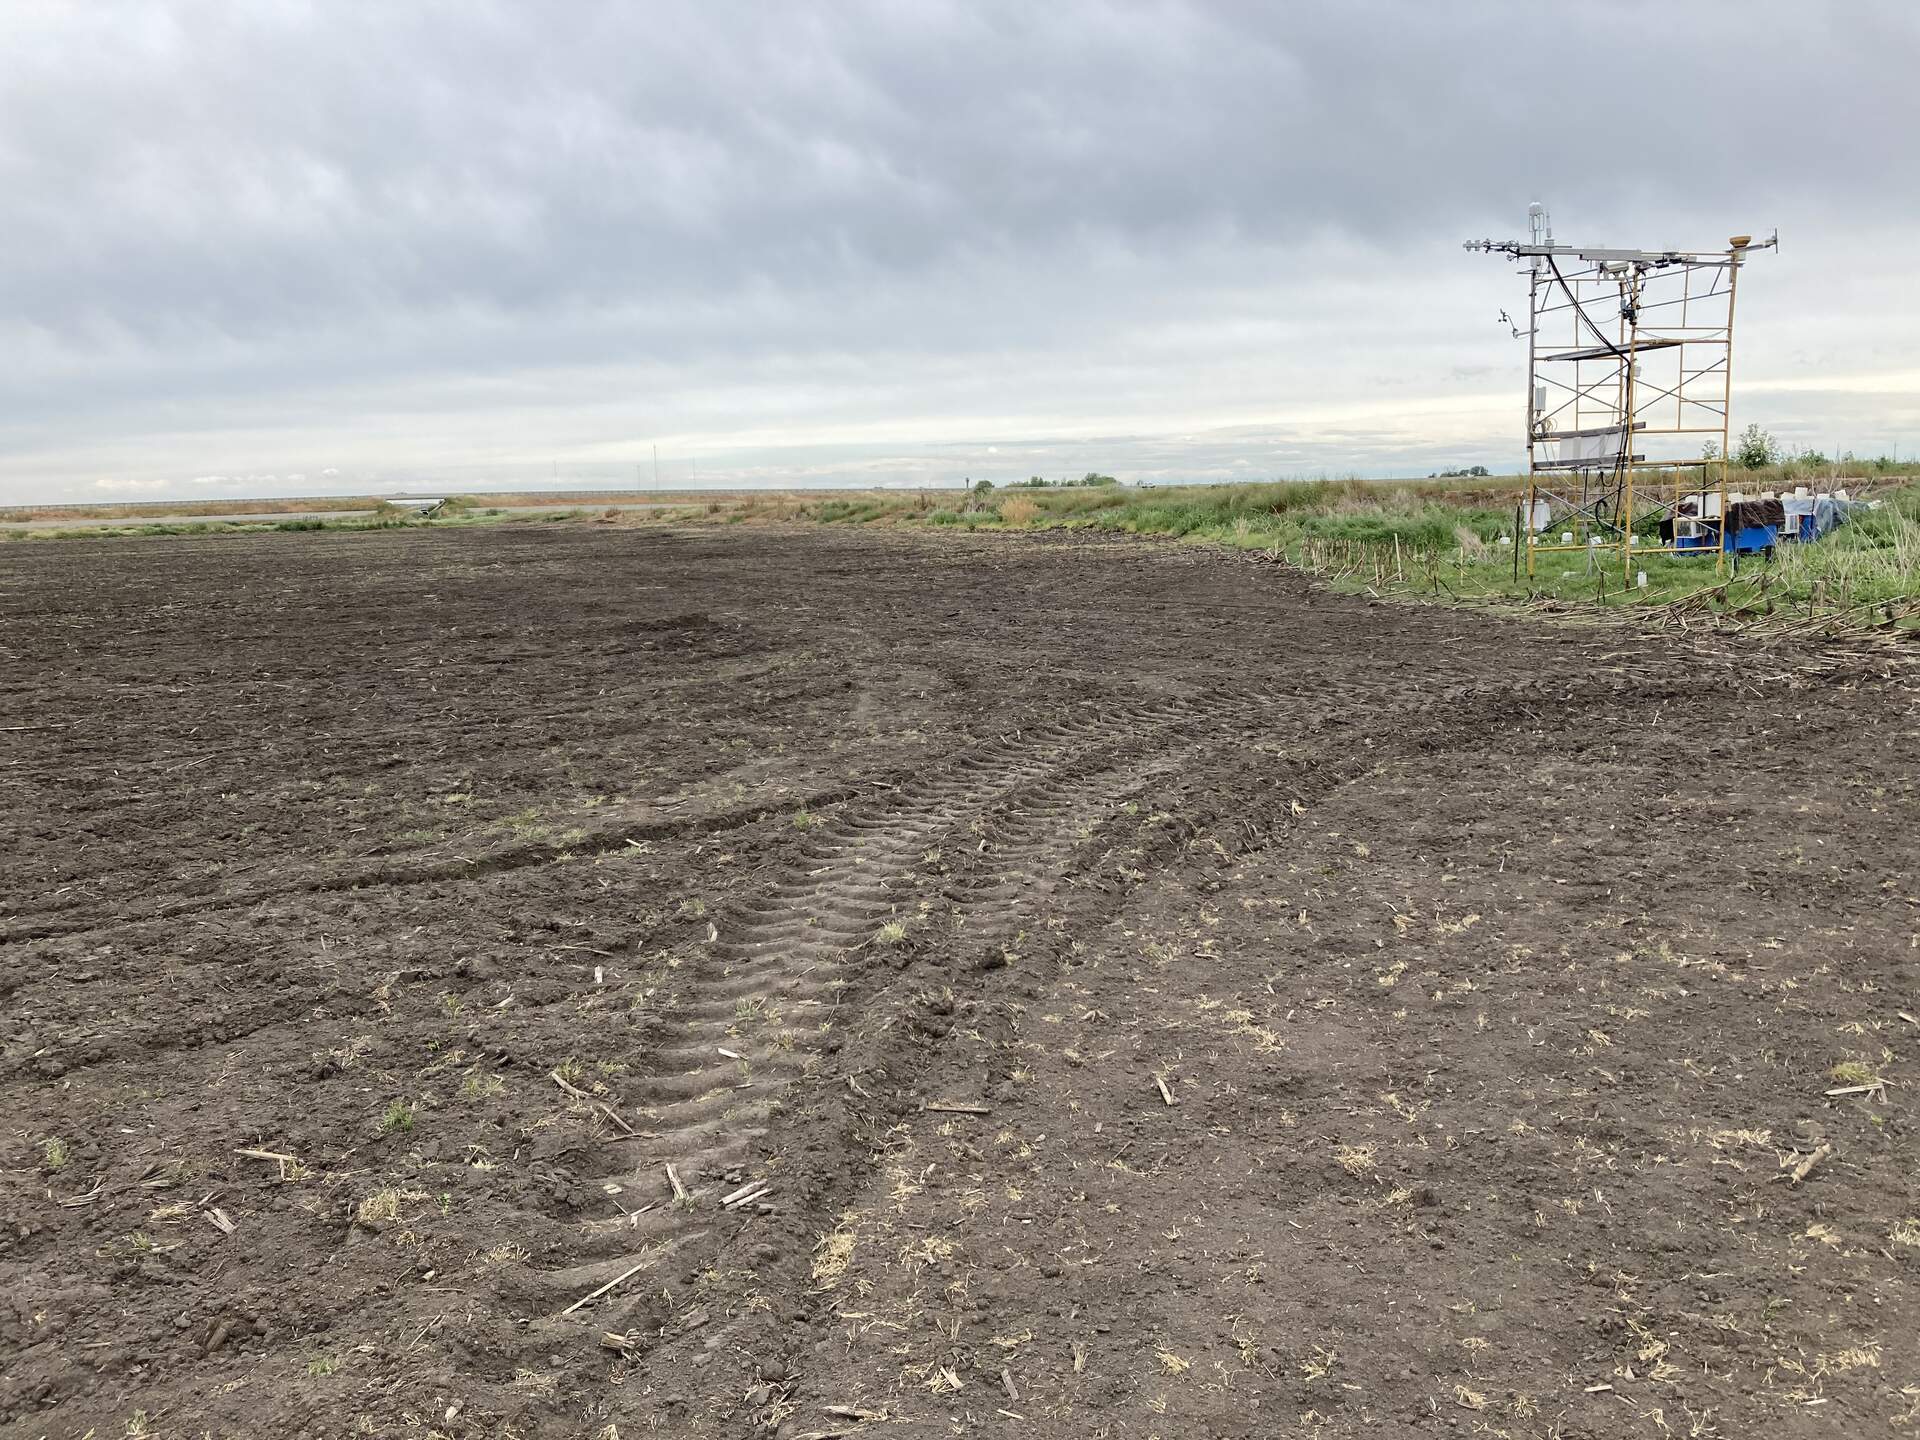
20230503BC_FieldTilled.jpg ( 2023-05-03 15:19:06 ) Full size: 1920x1440
Our field has been tilled. Tractors working on nearby fields.
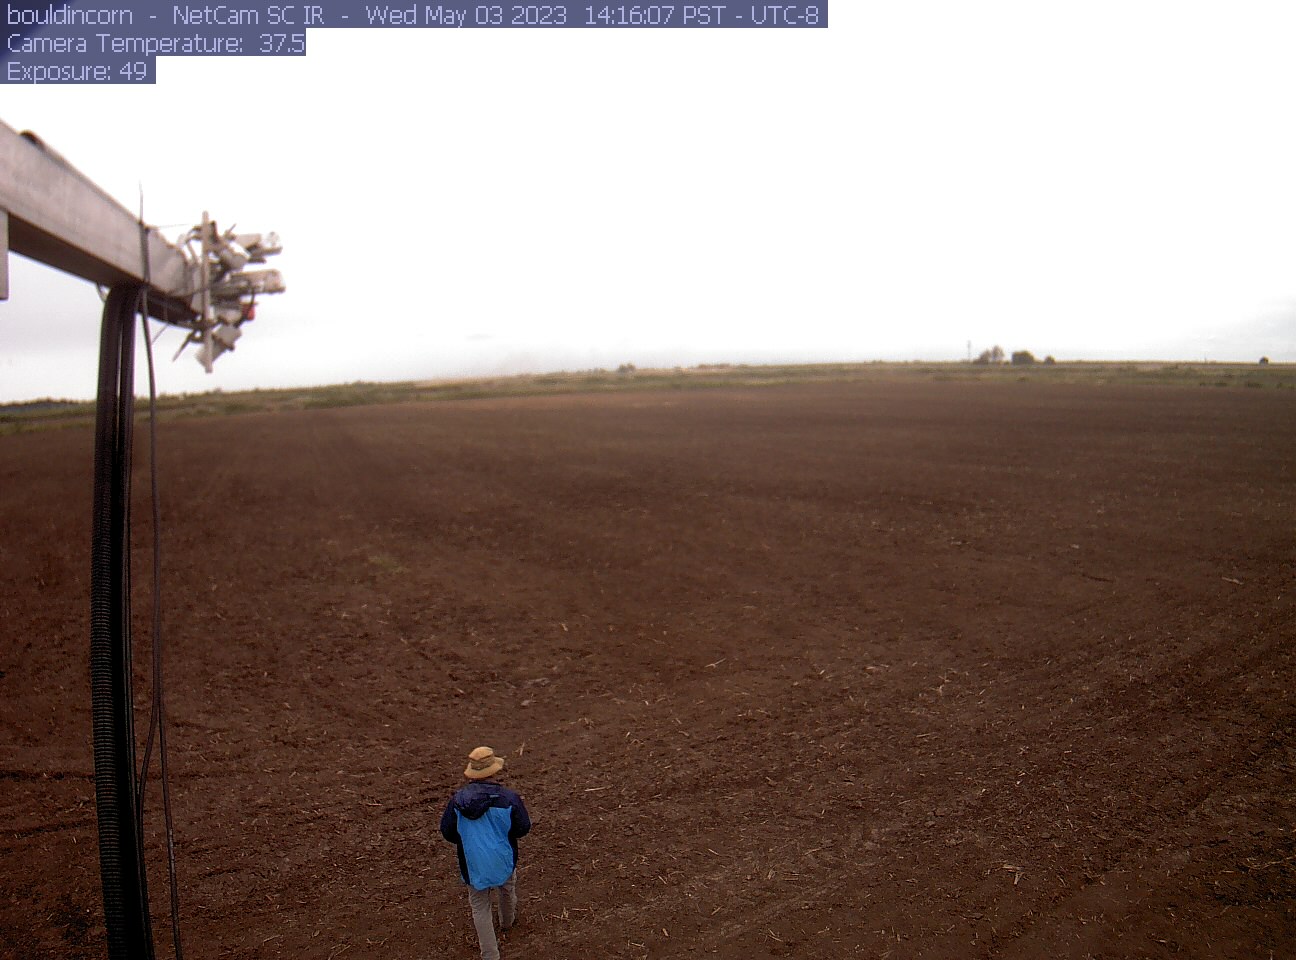
bouldincorn_2023_05_03_141505.jpg ( 2023-05-03 22:17:24 ) Full size: 1296x960
Joe on site
6 sets found
17 BC_met graphs found
5 BC_flux graphs found
Can't check TATWBABCSB_cam
Can't check MBSWEEWPBCBA
2 BC_pa graphs found
1 BC_arable graphs found