
Field Notes
<--2023-02-08 12:30:00 | 2023-03-16 11:50:00-->Other sites visited today: Vaira
Phenocam link: Searching...
Tonzi: 2023-03-01 12:15:00 (DOY 60)
Author: Joe Verfaillie
Others:
Summary: Just after a few days or rain - water everywhere, Standard data collection swapped soil co2 battery bank, install open FD chamber, new Li power pack for IRT, Delta laptop - did not collect Road well logger.
| Tonzi 2023-03-01 I arrived at about 12:15. It was clear and sunny with an icy wind from the northwest swinging around to be more westerly. It’s been raining the last few days and there is water everywhere. The pond is up to the edge of the road. Every small depression had water in it. The mutant tree near Mr. Tonzi’s house that is always a week or so ahead of the rest has a few small leaves at the tips. But it’s been freezing still with more rain to come. At the Tower the tower top data had not been updated but seemed to work just fine when I pushed it. Because of the wind I spent a minimum of time on the tower. All the data looked okay. The IRT CR1000 is still having power problems. Zcam2 lost its clock and will need a new clock battery next time. I measured the soil moisture, well levels (forgot to write down Tower well maybe memory ok), and DBH. I collected the fluxes, met data, camera and FD data. The usual field laptop died in the lab this week so I was using the Delta laptop which worked just fine except not having the software for the Global Water logger in the Road Well. The Tower read: 422.6ppm CO2, 244.5mmol/m3 H2O, 8.92C, 98.6kPa, 102.0SS The Floor read: 425.9ppm CO2, 234.8mmol/m3 H2O, 10.9C, 98.7kPa, 99.4SS I tried to update the SoilCO2 battery bank sn BB-TZ_soilco2. I brought the three batteries last remove from HS and put them under the solar panels. I rewired all the panels into a terminal strip. One of the big panels has a broken solder joint on its diode – I left this panel disconnected. I tried to use the existing charge controller sn 12501588 but it never displayed any solar amps – I bought it in for testing. Instead I installed a new 6A controller sn 21501223. This one only has idiot lights but it looked like it was charging. I reconnected the Tree1 FD and collected its data – lots of missing data. I installed FD sn FD20190027 freshly back from service in the open location – it seemed to be working. I used the one old battery that test okay with the load tester to replace the fence charger battery. I fixed the fence wires again (there were deep cow hoof prints inside the fence. Not sure the fence charger is working well yet. We have some more in the lab that I should probably test and use to replace the ones in the field. I swapped the lithium power pack on the IRT system. The existing power pack was empty. The new pack is 12V so the wiring is a little simpler. Hopefully this will fix the problem. Cows had pushed the ground IRT around and out of its mount - fixed. I left at about 16:30 |
Field Data
No tank data
Well Depth
| Date | Location | Depth (feet) |
|---|---|---|
| 2023-03-01 | VR_well | 49.95 |
| 2023-03-01 | VR_pond | 22.38 |
| 2023-03-01 | TZ_floor | 22.15 |
| 2023-03-01 | TZ_road | 30.25 |
No TZ Moisture Point data found
No VR Moisture Point data found
No TZ grass heigth found
No VR grass heigth found
Tree DBH
| Date | Tag# | Reading (mm) |
|---|---|---|
| 2023-03-01 | 1 | 12.4 |
| 2023-03-01 | 102 | 5.5 |
| 2023-03-01 | 2 | 19.6 |
| 2023-03-01 | 245 | 7.2 |
| 2023-03-01 | 3 | 23.2 |
| 2023-03-01 | 4 | 21.2 |
| 2023-03-01 | 5 | 12.6 |
| 2023-03-01 | 6 | 22.7 |
| 2023-03-01 | 7 | 13.4 |
| 2023-03-01 | 72 | 17.1 |
| 2023-03-01 | 79 | 16.0 |
No water potential data found
No TZ Grass Biomass data found
No TZ OakLeaves Biomass data found
No TZ PineNeedles Biomass data found
3 photos found
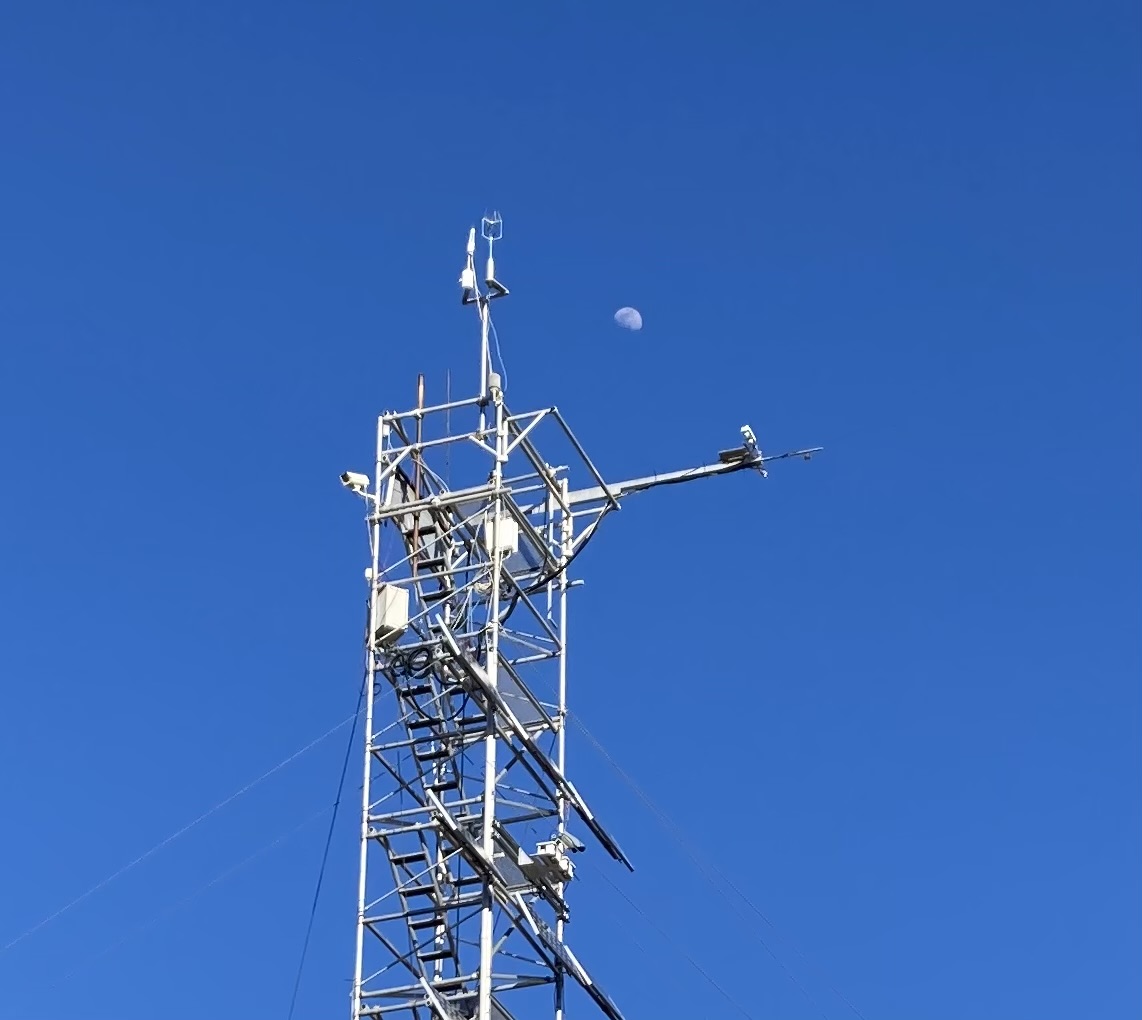
20230301TZ_TowerAndMoon.jpg ( 2023-03-01 16:05:21 ) Full size: 1142x1020
The moon near the top of the tower

20230301TZ_Pond.jpg ( 2023-03-01 16:27:32 ) Full size: 1920x994
The pond is about as full as it gets

20230301TZ_MutantTreeLeaved.jpg ( 2023-03-01 16:28:45 ) Full size: 1920x1675
The mutant tree near Mr Tonzi’s house has a few leaves usually a week or so early
16 sets found
No data found for TZ_Fenergy.
11 TZ_tmet graphs found
No data found for TZ_soilco2.
Can't check TZ_mixed
3 TZ_mixed graphs found
1 TZ_fflux graphs found
8 TZ_fmet graphs found
No data found for TZ_tram.
3 TZ_co2prof graphs found
No data found for TZ_irt.
No data found for TZ_windprof.
1 TZ_tflux graphs found
8 TZ_sm graphs found
Can't check TZ_met
1 TZ_met graphs found
Can't check TZVR_mixed
8 TZ_osu graphs found
3 TZ_fd graphs found
Tonzi Z-cam data