
Field Notes
<--2022-09-28 10:30:00 | 2022-11-03 10:00:00-->Other sites visited today: Mayberry | West Pond | East End
Phenocam link: Searching...
Gilbert Tract: 2022-10-19 09:35:00 (DOY 292)
Author: Daphne Szutu
Others: Robert, Kyle
Summary: Regular data collection/cleaning, installed new CTD, cleaned ADCP, pulled out submerged aquatic vegetation
| 2022-10-19 Gilbert Tract Robert, Kyle D., and I arrived at 9:35 PDT. It was mild with great visibility; mostly clear with clouds near the horizon. We could see and hear many red-winged blackbirds and other birds we couldn’t identify. This was Kyle’s first visit to our wetland sites to learn more about our research. The staff gauge read 20cm at 9:30 PST. We started at the tower. I downloaded met, cam, USB GHG, and miniDOT data. Robert and Kyle cleaned flux and rad sensors and refilled the wash reservoir. I changed the eddy clock +1min from 8:44 to 8:45 to match the laptop time and restarted logging afterwards. I changed the miniDOT desiccant. I checked the Campbell conductivity sensor for its routine check every 3 months; its orifice looked clean. I installed a brand-new CTD sensor METER HYDROS21 sn H21G20001202 off of the boardwalk along with the eosGP and Campbell conductivity sensors. When the staff gauge read 21cm, the bottom of the sensors were 19cm below the water surface. I coached Robert through changing the CR1000 program to update the SDI-12 instruction with the SDI-12 address of the new sensor, 0. I forgot to change the SDI-12 address to this sensor before I brought it to the field, so it still has the factory default address of 0. I’ll make sure to note its SDI-12 address in the equipment history. I applied copper tape to the outside of the CTD sensor. The other water sensors all looked pretty clean so I didn’t put on copper tape today. The 7500 read: 439ppm CO2, 690mmol/m3 H2O, 22.4C, 101.9kPa, 102SS – 106 after cleaning The 7700 read: 2.75ppm CH4, 35RSSI – 86 after cleaning We headed to the channel around 10:50 PDT. I downloaded data from Flo (our flowmeter). As usual, I updated the clock, declined to calibrate the pressure sensor, and restarted logging after the download. Robert got in the water and pulled up all of the submerged aquatic vegetation around the sensor. Probably Brazilian Waterweed (Egeria densa), and some sort of hair algae. https://www.invasivespeciesinfo.gov/aquatic/plants/brazilian-waterweed We pulled the sensor up out of the water and Kyle used a rag and the pump sprayer to clean hairy algae off of the flowmeter. We pushed the sensor back into the water as far as it would go. I think the sensor is at the same position along the bank as before, but the bolt was not quite lined up with the hole at the top, as though the pole had twisted a bit in our pulling/pushing. We ended up securing the pole with a ziptie through the bolt hole. I left the bolt and nut in the battery enclosure. We left at 11:20 PDT. |
5 photos found
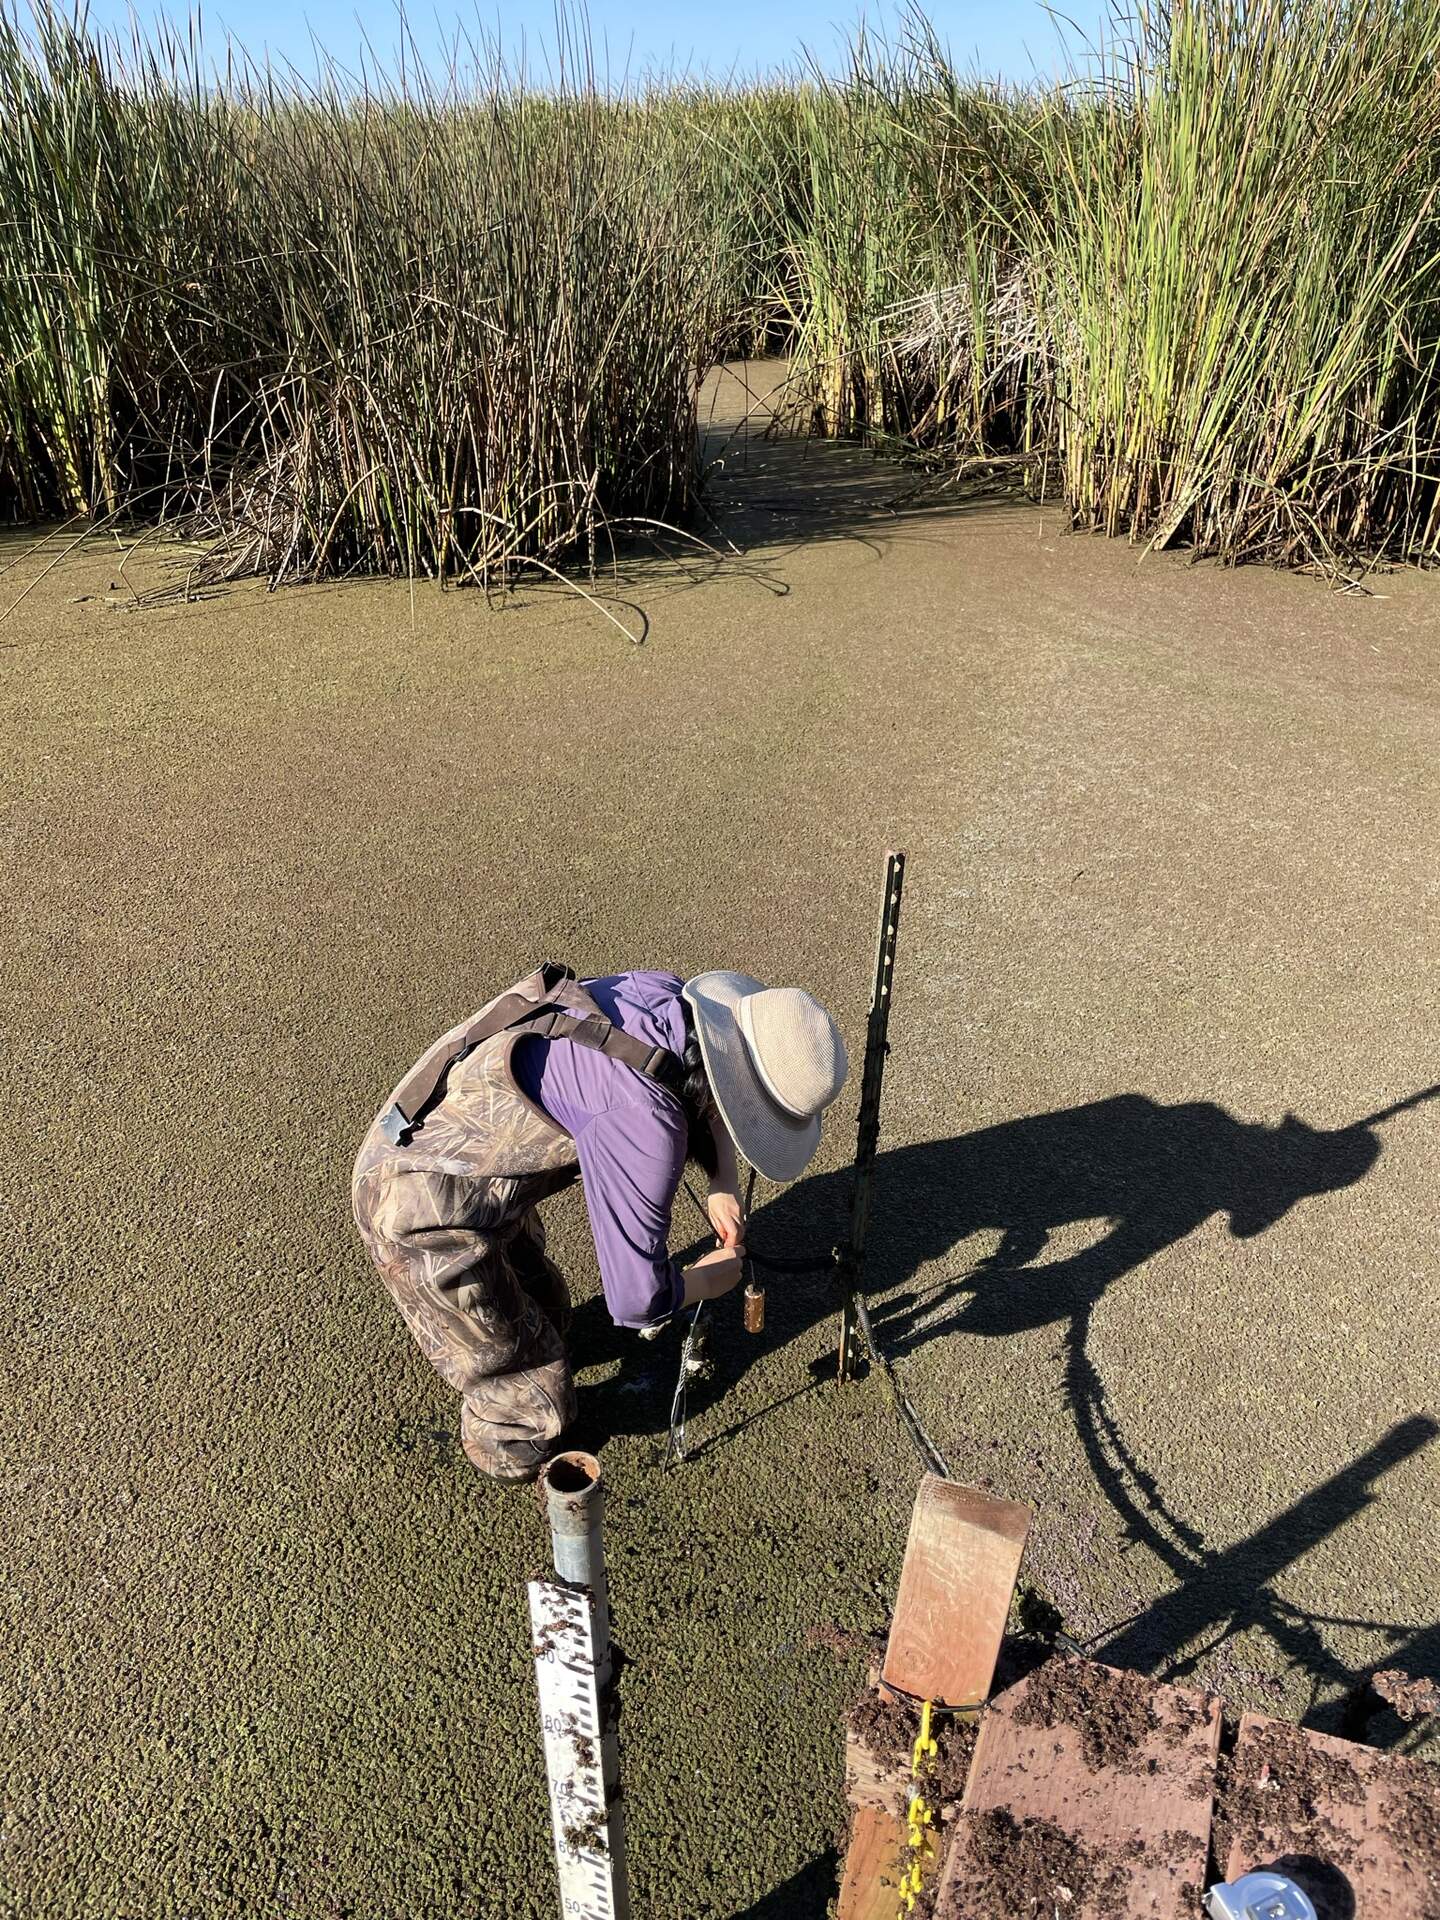
20221019GT_DaphneBoardwalk.jpg ( 2022-10-19 10:02:31 ) Full size: 1440x1920
Daphne installing the new copper-taped CTD sensor off of the Gilbert Tract boardwalk
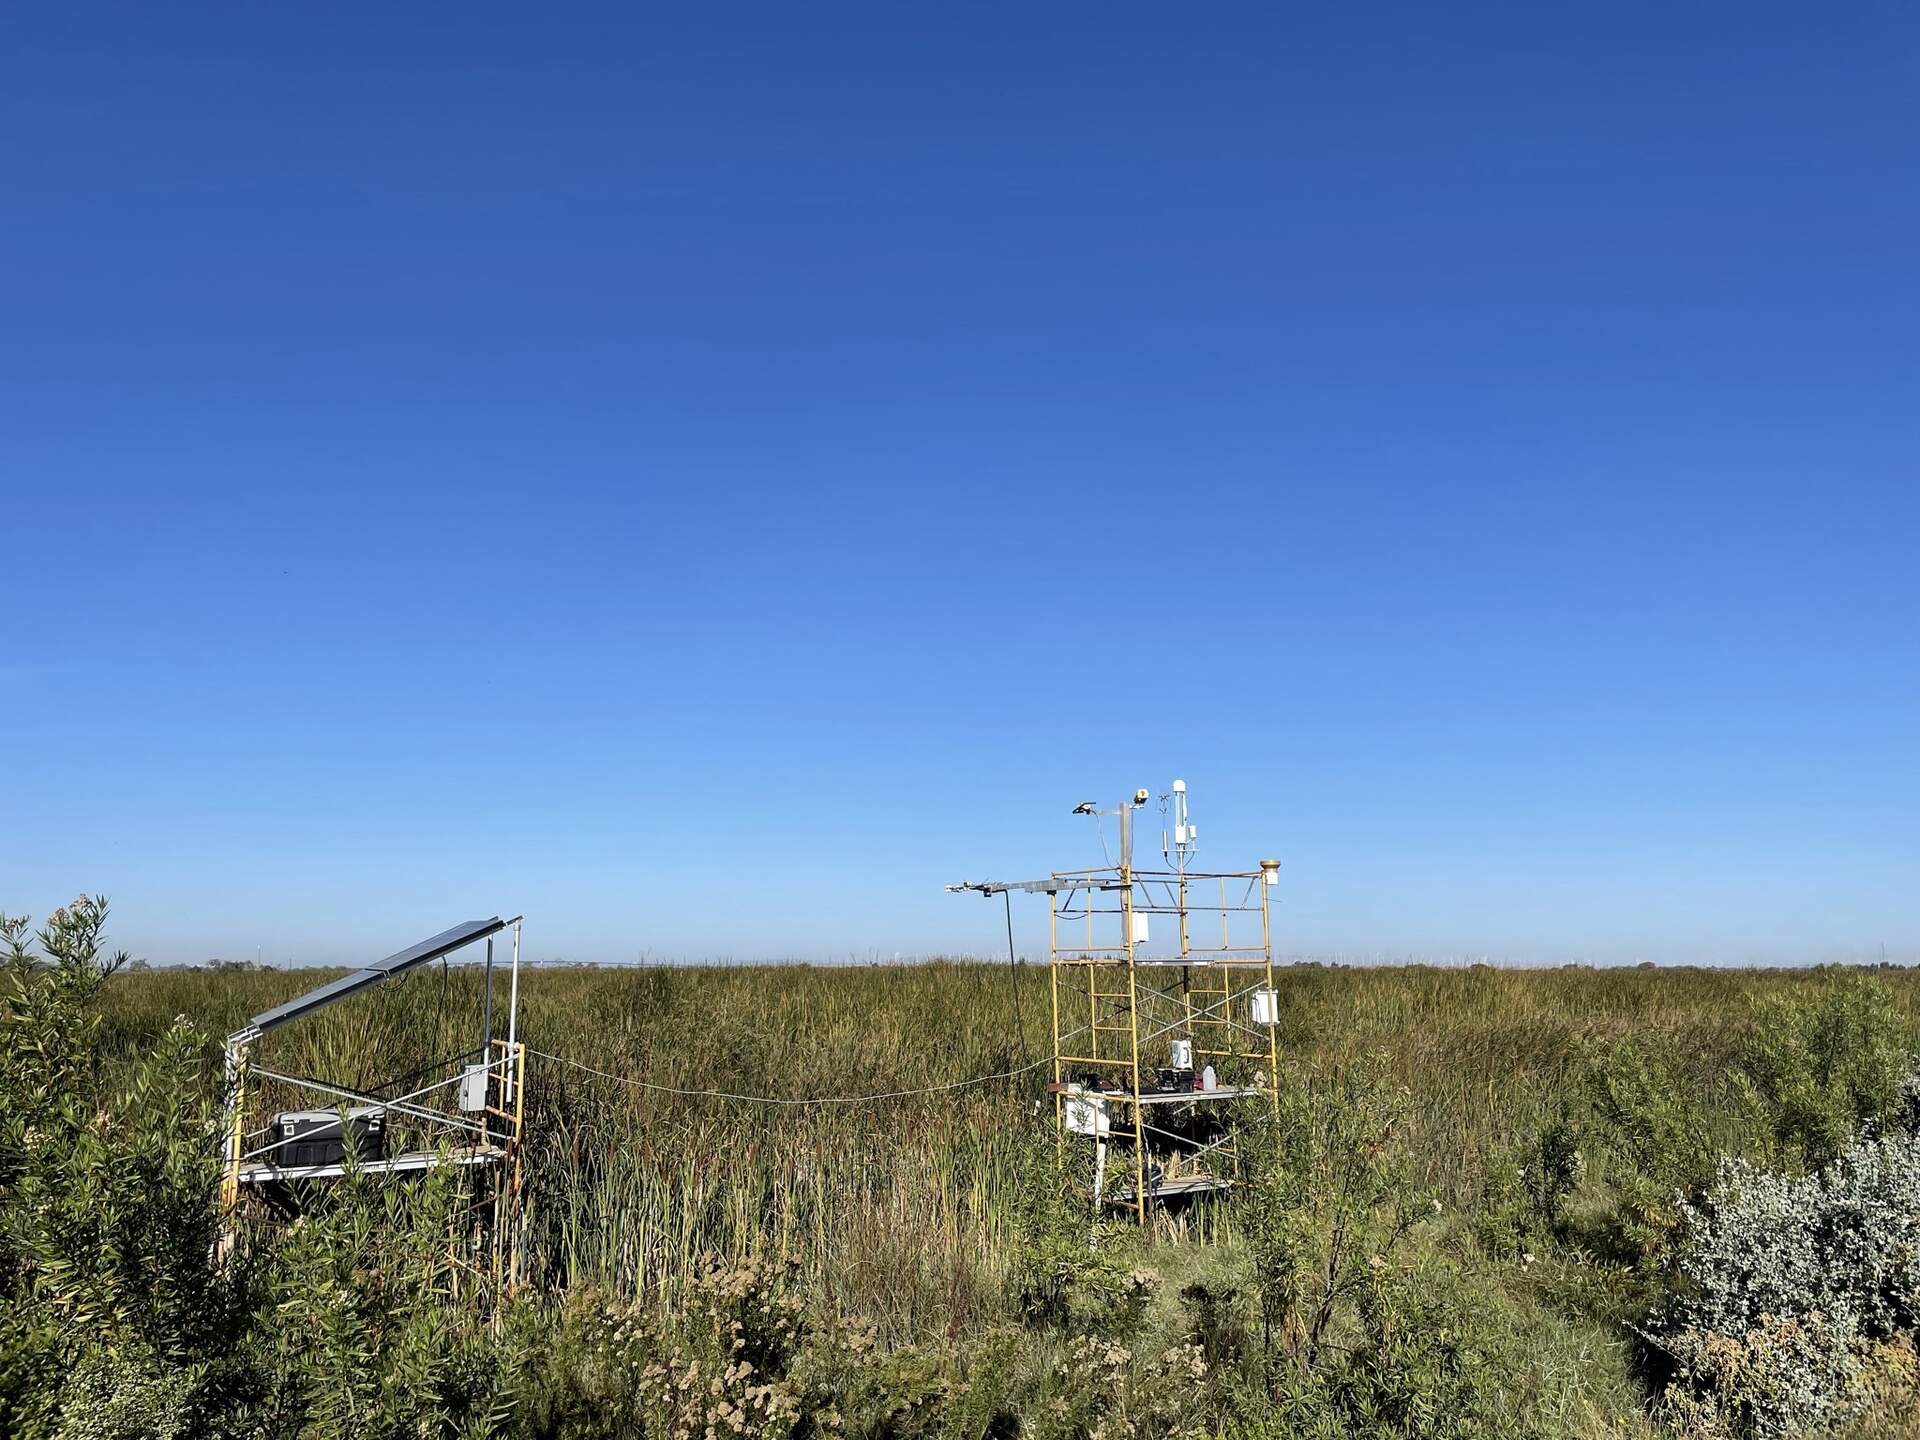
20221019GT_Site.jpg ( 2022-10-19 09:57:22 ) Full size: 1920x1440
Solar panel and tower scaffolding
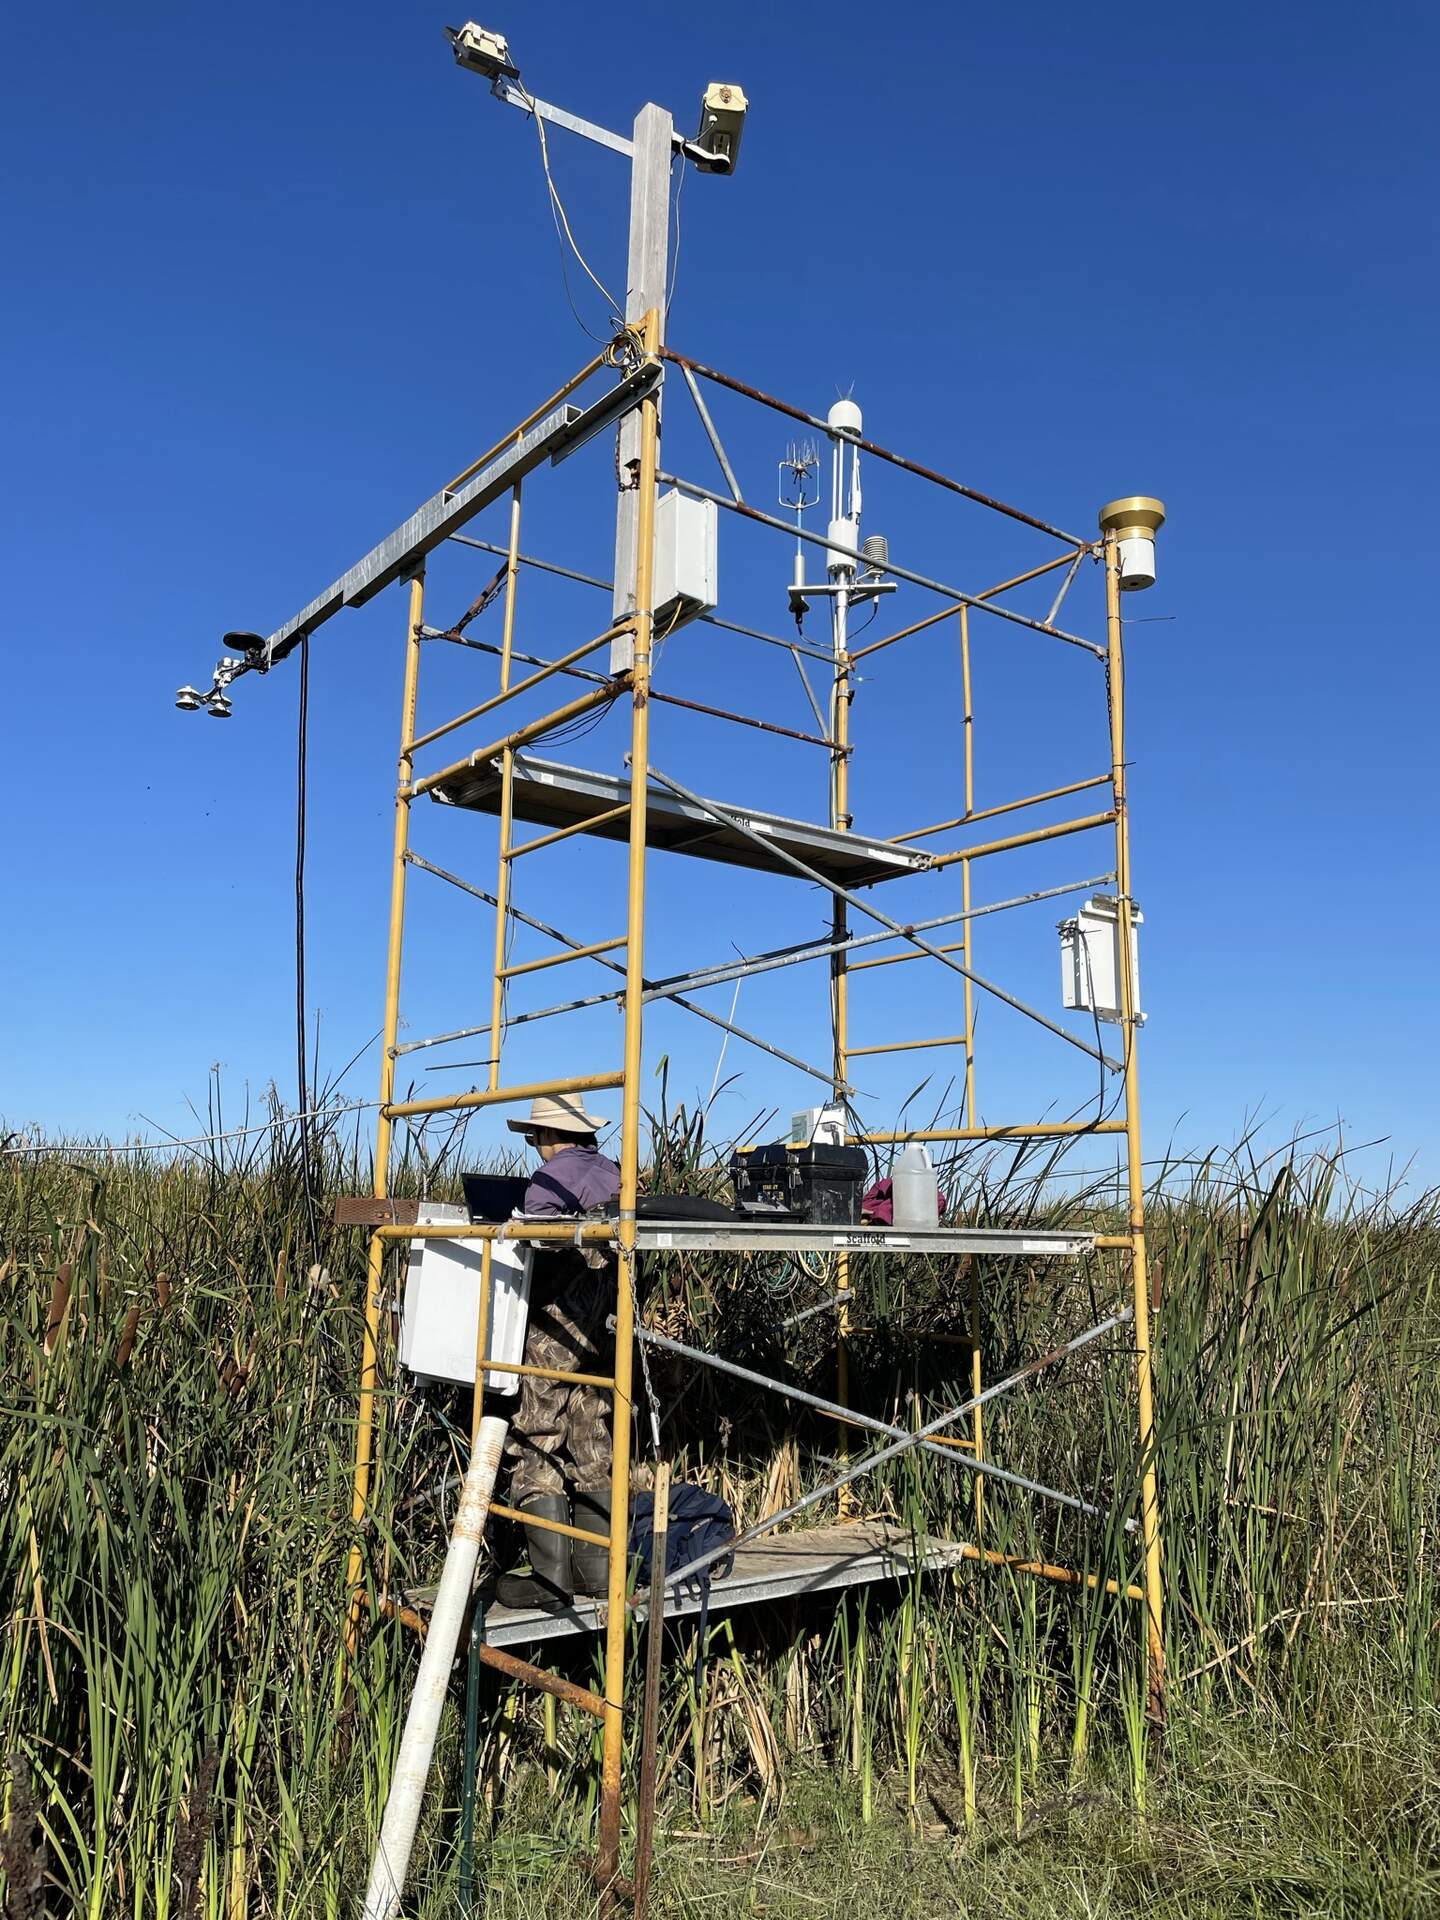
20221019GT_Tower.jpg ( 2022-10-19 09:58:58 ) Full size: 1440x1920
Daphne on site
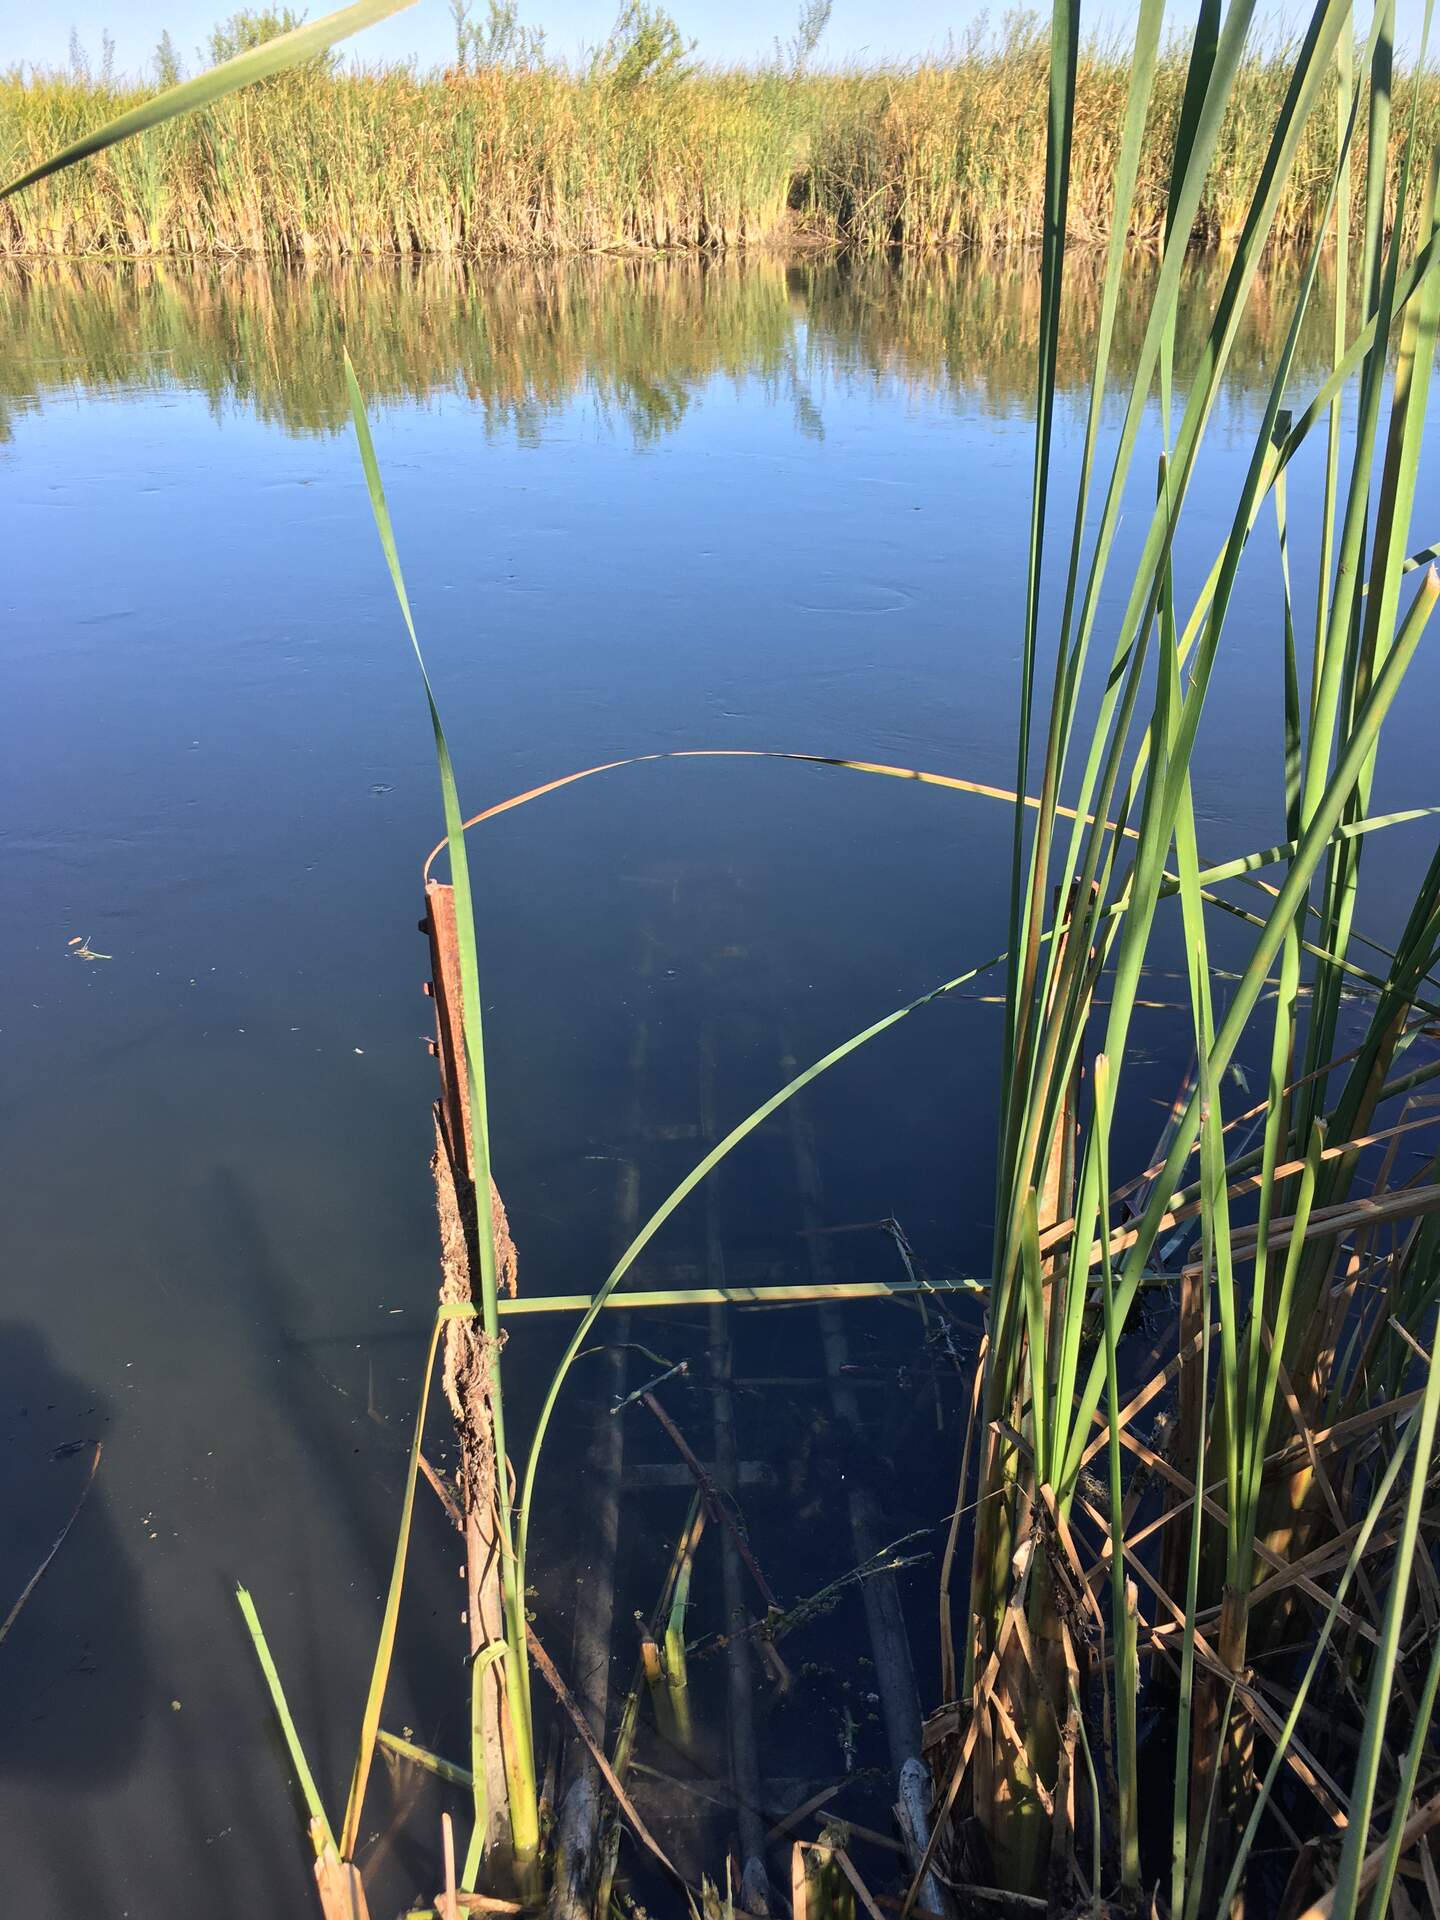
20221019GT_Flo.jpg ( 2022-10-19 11:19:23 ) Full size: 1440x1920
Robert removed all of the submerged aquatic vegetation surrounding the ADCP. We can finally see the sensor in the water!

gilberttract_2022_10_19_084405.jpg ( 2022-10-19 09:49:20 ) Full size: 1296x960
Kyle and Robert on site
8 sets found
Can't check MBWPEESWGT_mixed
Can't check MBEEWPSWEPGT_cam
16 GT_met graphs found
4 GT_flux graphs found
3 GT_adcp graphs found
1 GT_cam graphs found
2 GT_usgs graphs found
No data found for GT_chanexo.