Field Notes
<--2022-09-28 13:35:00 | 2022-11-03 15:00:00-->Other sites visited today: Gilbert Tract | Mayberry | East End
Phenocam link: Searching...
West Pond: 2022-10-19 13:20:00 (DOY 292)
Author: Daphne Szutu
Others: Robert, Kyle
Summary: Regular data collection/cleaning, low water level, sleepy wasps
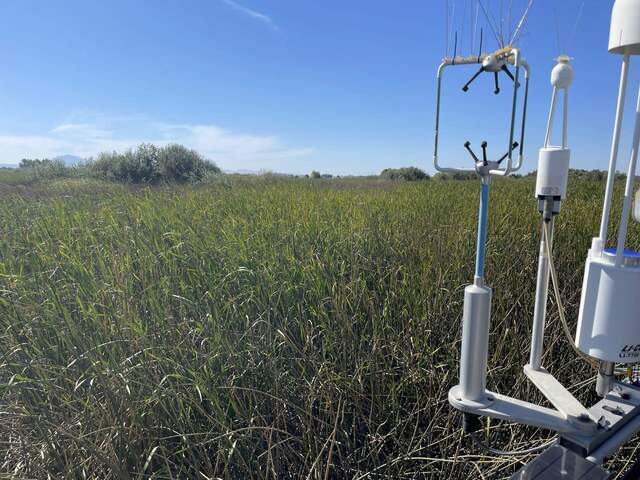
| 2022-10-19 West Pond Robert, Kyle D., and I arrived at 13:20 PDT. The main Twitchell gate was open so I checked the combo on the lock. The combo in my notes didn't work, so I texted Bruce for the new code. I shared the new code with Joe. It was warm and still with scattered thin clouds. There were some wasps buzzing about but they weren’t aggressive. The water level is low, below the staff gauge. The water level will probably stay low until it starts raining and water quality (salinity) improves. There is one patch of tules SSW of the tower that looks mostly dead. Otherwise, the cattails and tules look about half brown. It's a bit hard to compare the two species directly because the tules are mostly farther away from the tower and harder to see. I downloaded met, cam, USB GHG, and miniDOT data. The miniDOT is out of the water now. Kyle and Robert cleaned the flux and rad sensors. I think I topped off the wash reservoir. I changed the eddy clock +1min from 12:28 to 12:29 PST to match the laptop time and restarted logging afterwards. The 7500 read: 420ppm CO2, 497mmol/m3 H2O, 31.0C, 101.6kPa, 98SS – forgot to write after cleaning The 7700 read: 2.0ppm CH4, ??RSSI– 90 after cleaning We left at 13:40 PDT. |
1 photos found

20221019WP_Footprint.jpg ( 2022-10-19 13:29:41 ) Full size: 1920x1440
Flux sensors and footprint of senescing cattails
8 sets found
Can't check WP_DO
1 WP_DO graphs found
14 WP_met graphs found
5 WP_flux graphs found
Can't check MBWPEESWGT_mixed
Can't check MBEEWPSWEPGT_cam
Can't check MBSWEEWPBCBA
1 WP_processed graphs found
4 WP_arable graphs found

