
Field Notes
<--2022-05-12 15:20:00 | 2022-06-09 11:50:00-->Other sites visited today: Vaira | Tonzi | West Pond
Phenocam link: Searching...
East End: 2022-05-26 17:30:00 (DOY 146)
Author: Joe Verfaillie
Others: Carlos
Summary: Tried to fix splice 7700 power cable but replacement too short, standard data collection, notice two different species of tule.
| East End 2022-05-26 Carlos and I arrived at about 17:30 PDT. It was windy, cool and overcast. This site is much greener than West pond. The water level was high here too but I forgot to write it down. Sitting on the boardwalk I had to be careful not to get my feet in the water. We tried to swap the power cable that was cut and spliced with a screw terminal last time, but the replacement cable we had was about a meter too short. And a little more length would let the cable follow the scaffolding rather than run at an angle which might have contributed to it getting cut last time. We left the spliced cable in place for now. Carlos cleaned the sensors and I collected the data. The 7500 read: 423.2ppm CO2, 584.7mmol/m3 H2O, 17.9C, 100.9kPa, 95.5SS The 7700 read: 2.0ppm CH4, 37.5RSSI – 81.4 after cleaning. We refilled about 1/3 of the wash reservoir. On the way out I was noticing that some patches of tule looked green and others looked bluish. The green ones had stems with a triangular cross section while the bluish ones have the round cross section. These seem to be “Schoenoplectus (Scirpus) acutus, Schoenoplectus (Scirpus) californicus. Difference: California Tule – bright green triangular stems, Common Tule – grey green round stem.” We left at about 18:00 PDT. |
1 photos found
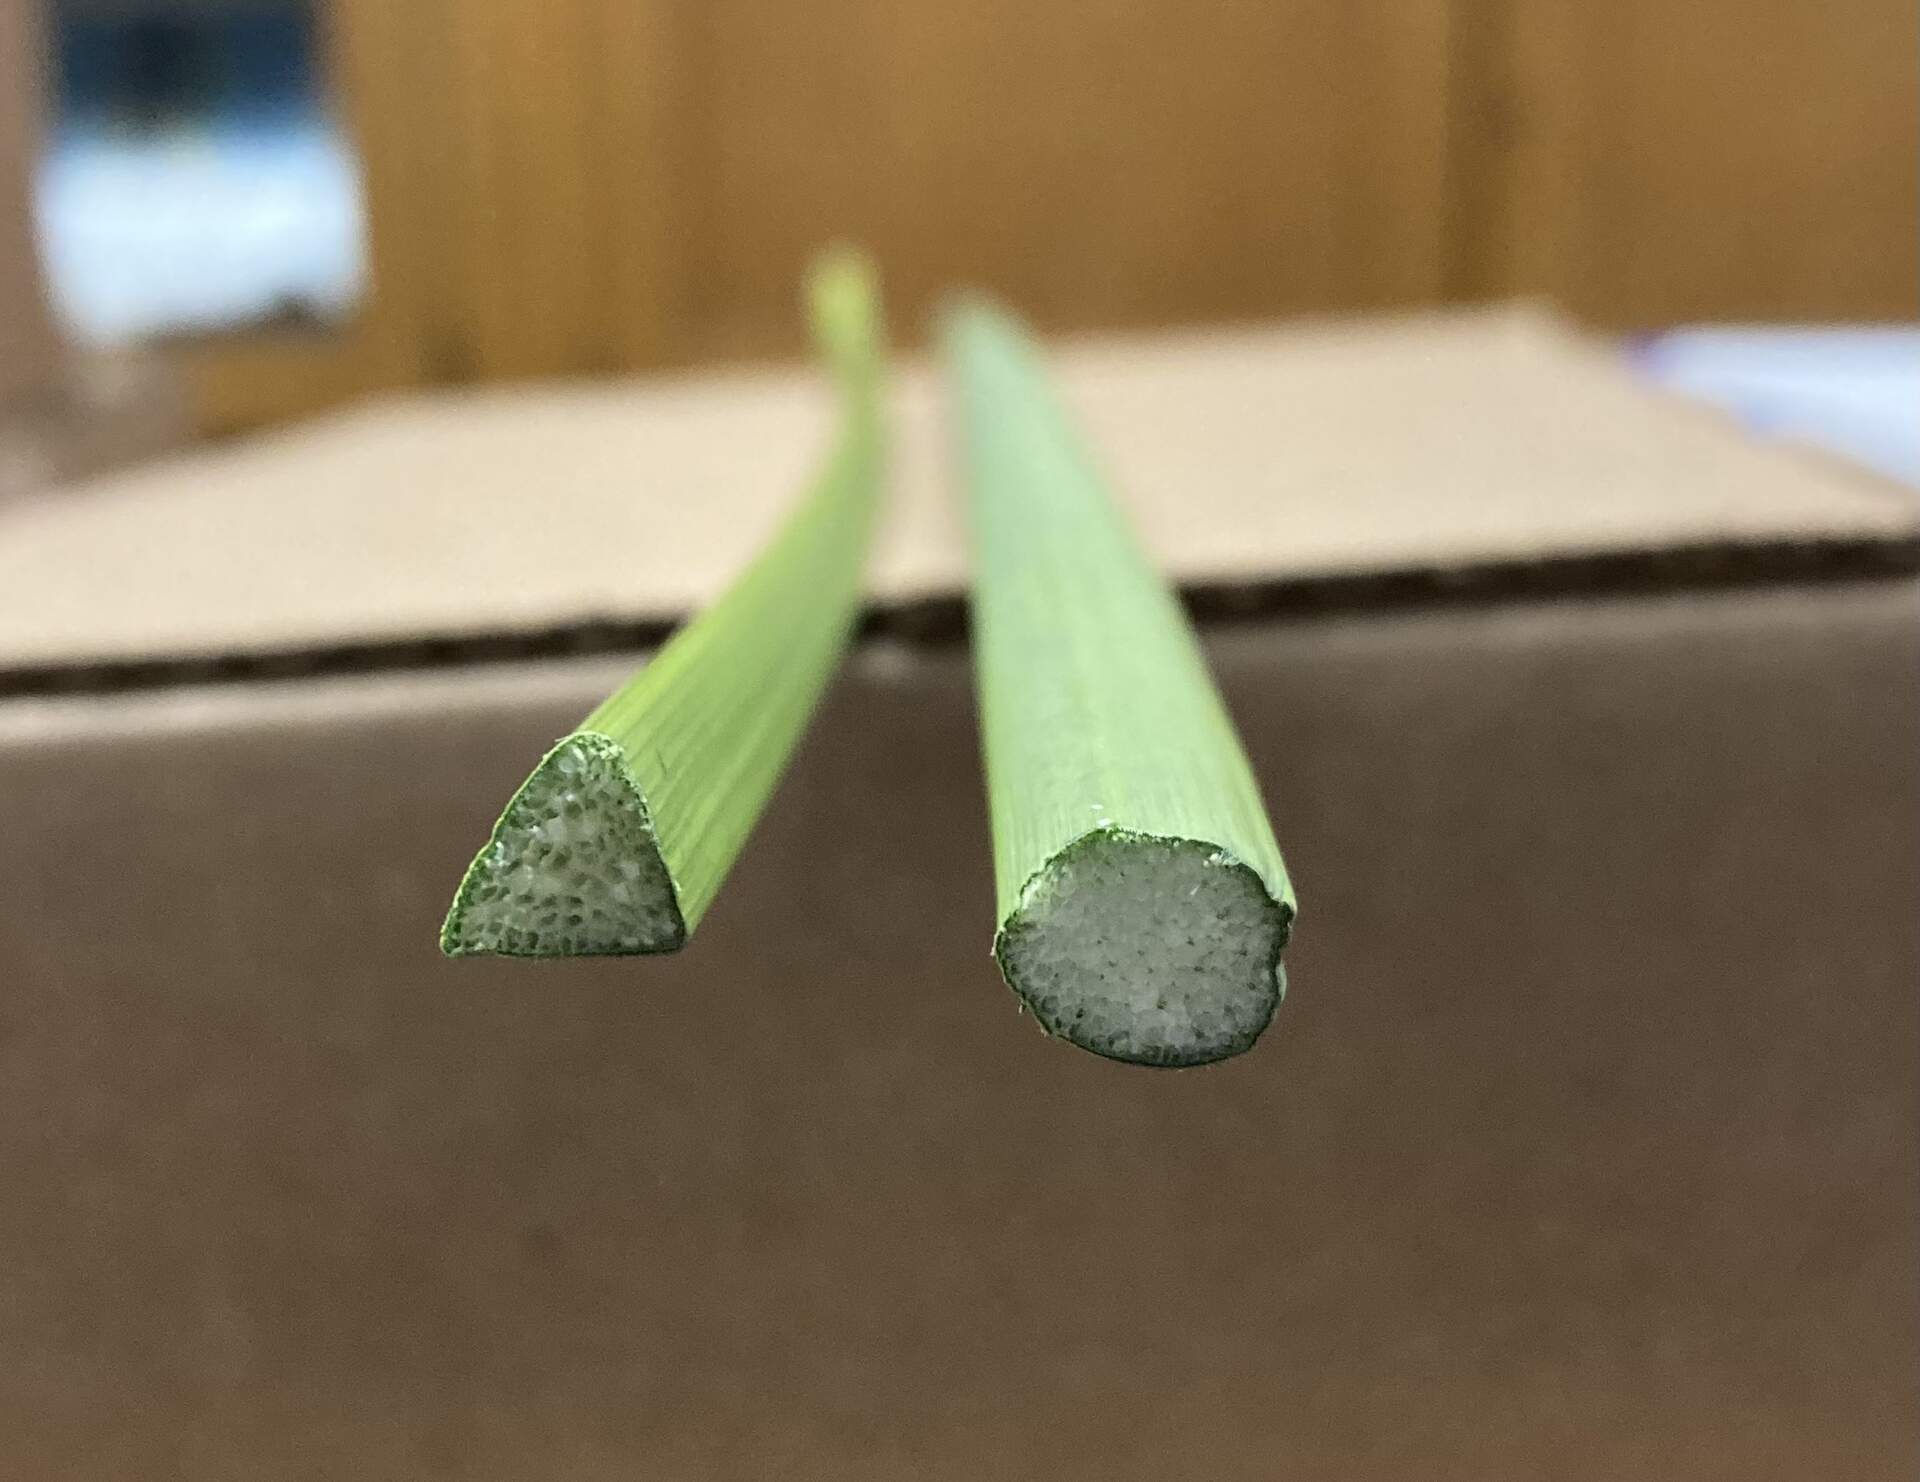
20220526EE_DifferentTules.jpg ( 2022-05-27 06:47:19 ) Full size: 1920x1482
Two different species of tules
11 sets found
14 EE_met graphs found
Can't check EE_mixed
1 EE_mixed graphs found
8 EE_flux graphs found
Can't check MBWPEESWGT_mixed
1 EE_cam graphs found
Can't check MBEEWPSWEPGT_cam
Can't check SIMBTWEE_met
Can't check EE_Temp
5 EE_Temp graphs found
Can't check EE_minidot
1 EE_minidot graphs found
Can't check MBSWEEWPBCBA
1 EE_processed graphs found