Field Notes
<--2022-04-25 10:45:00 | 2022-04-27 18:30:00-->Other sites visited today: Gilbert Tract | East End | Bouldin Corn
Phenocam link: Searching...
Bouldin Alfalfa: 2022-04-26 14:00:00 (DOY 116)
Author: Daphne Szutu
Others: Carlos
Summary: Check on yesterday's installations and download data from the 3 towers
| 2022-04-26 Bouldin Alfalfa Carlos and I arrived around 14:00 PDT. It was breezy and clear. Yesterday was a big day here setting up 2 temporary towers for this summer’s advection experiment. Today was a relatively quick stop to download data and check on everything. Main Tower Yesterday we noticed the BAMet CR1000 program had some skipped scans. The average processing time was around 7 sec, but the max processing time was >10sec. I made some changes to the BAMet CR1000 program to remove legacy code and streamline it based on Joe’s emailed suggestions. I watched it for about a minute and avg/max processing time were ~6sec. However, I probably didn’t catch the minute where the soil moisture sensors are measuring, so max processing time might be longer. The CR1000 with extra sonics looked ok. The CF card had the appropriate amount of data and the new CF card seemed to mount find, card status = OK. The 10sec T/RH data looked ok. I downloaded met, USB GHG, and cam data again even though I just downloaded them yesterday. I did not download FD and IRT data today since I downloaded them yesterday. Carlos cleaned flux and rad sensors. He said the 4-way radiometer was dirty. I didn’t have my ethernet-USB dongle I use to connect to the 7550, so I couldn’t see live GHG data. However, there were the right number of files on the USB drive and the LED lights were blinking appropriately, so it should be ok. Bouncer Tower I downloaded USB, CR6, and CR23X data. I checked all the 30-min data in ViewPro and they looked fine. Back in the lab, I couldn’t find the Bouncer USB data. Maybe I forgot to move the files and now they’re on the USB stick at the Edge 7550. I didn’t have my ethernet-USB dongle I use to connect to the 7550, so I couldn’t see live GHG data. However, there were the right number of files on the USB drive and the LED lights were blinking appropriately, so it should be ok. Edge Tower I finally found my ethernet-USB dongle here! Of course, it was at the last site of the day, which makes sense because this was also yesterday’s last site of the day. I downloaded USB, CR6, and CR23X data. I checked all the 30-min data in ViewPro and they looked fine. The 7550 temp sensor was not working; it was reading 45C. This is the homemade sensor that was bad and removed from GT. We repaired it last week for this set-up and it was working yesterday. I removed it to bring back to the lab. Joe will stop by BA tomorrow to add a diode to a solar panel so he may replace the temp sensor. Edge Tower: 450ppm CO2, 380mmol/m3 H2O, 45C (bad), 101.3kPa, 100SS We left at 15:25 PDT. |
Next Mowing: 2022-05-04
7 photos found
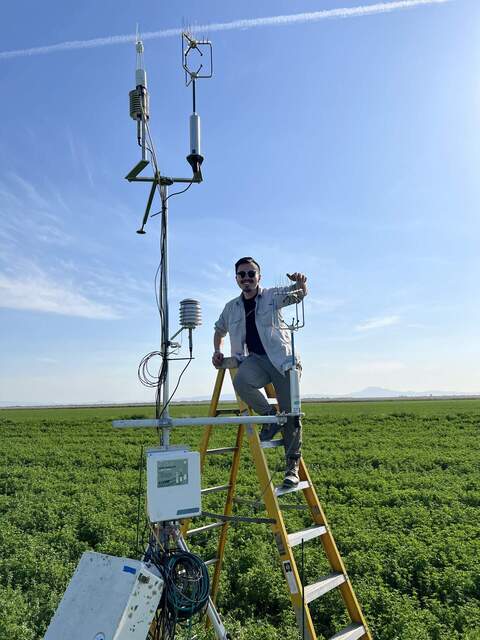
20220425BA_Edge.jpg ( 2022-04-25 17:10:10 ) Full size: 1440x1920
Carlos at the completed Edge Tower
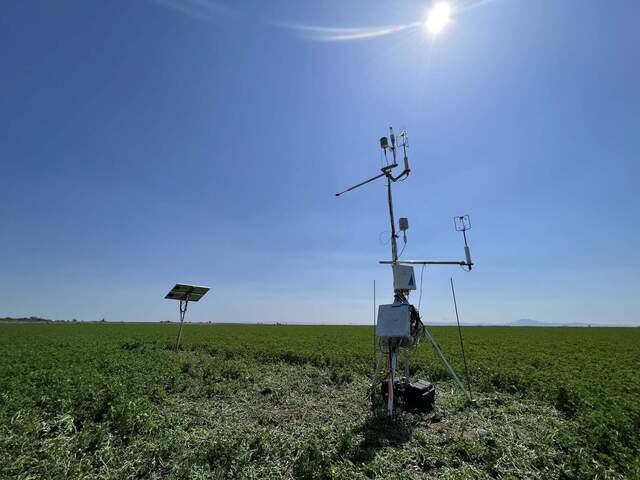
20220425BA_Bouncer.jpg ( 2022-04-25 14:57:33 ) Full size: 1920x1440
Bouncer Tower. Alfalfa all around the tower has been trampled by our setup process. Unfortunately this is also the alfalfa that the Rnet sees.
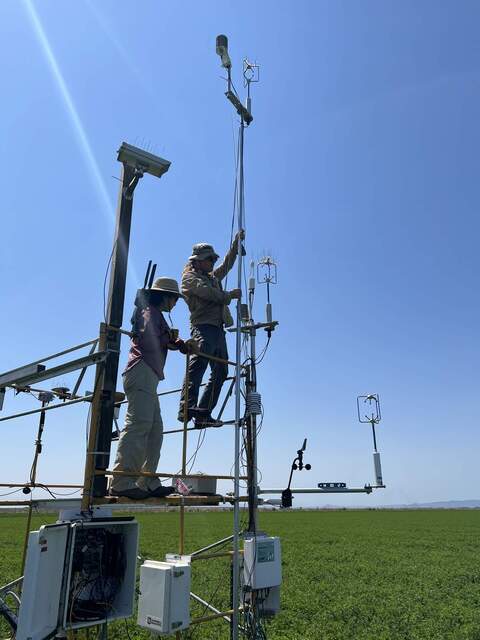
20220425BA_ExtraSonics.jpg ( 2022-04-25 11:52:39 ) Full size: 1440x1920
Daphne and Joe on the main tower setting up the extra sonics for the advection experiment
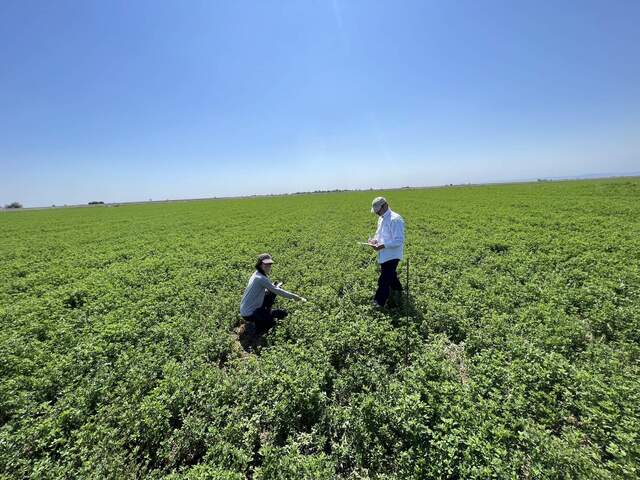
20220425BA_Irt.jpg ( 2022-04-25 11:42:11 ) Full size: 1920x1440
Ariane and Dennis taking IRT measurements of alfalfa around the same time as the Landsat 8 overpass
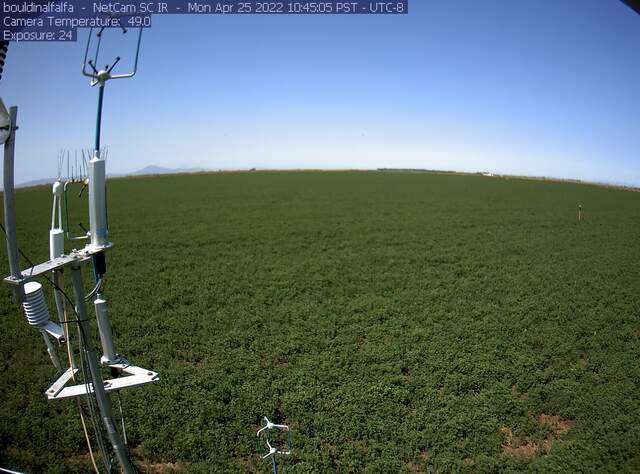
bouldinalfalfa_2022_04_25_104505.jpg ( 2022-04-25 11:46:04 ) Full size: 1296x960
Super advection study set up.
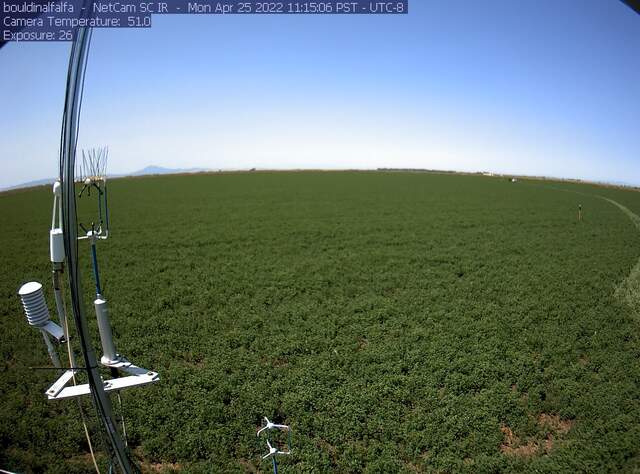
bouldinalfalfa_2022_04_25_111506.jpg ( 2022-04-25 12:16:04 ) Full size: 1296x960
Super advection study set up
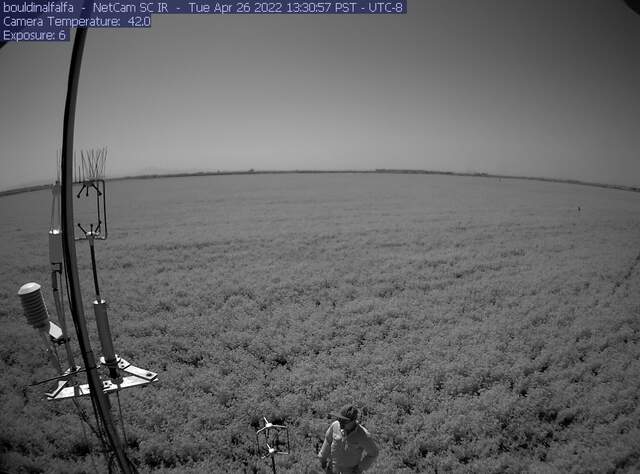
bouldinalfalfa_IR_2022_04_26_133057.jpg ( 2022-04-26 14:33:38 ) Full size: 1296x960
Carlos in IR
7 sets found
5 BA_flux graphs found
21 BA_met graphs found
6 BA_arable graphs found
Can't check TATWBABCSB_cam
Can't check MBSWEEWPBCBA
2 BA_processed graphs found
11 BA_adex graphs found

