
Field Notes
<--2022-04-13 15:45:00 | 2022-04-26 14:00:00-->Phenocam link: Searching...
Bouldin Alfalfa: 2022-04-25 10:45:00 (DOY 115)
Author: Joe Verfaillie
Others: Carlos, Dennis, Ariane, Daphne
Summary: Installation of advection experiment, standard data collection, Landsat overpass ground truth, replaced rotting upper boardwalk plywood.
| Bouldin Alfalfa 2022-04-25 Carlos and I arrived at 10:45 PDT. Dennis was already there and had nearly lost his discus after throwing it into the adjacent field. Daphne and Ariane arrived a few minutes later. It was sunny and clear with no wind to start, but a little breeze picking up by late afternoon. Fields to the north were being baled and the bales picked up. Our field was about knee high. A lot more weeds growing in all parts of the field (not just near our tower) than previous years. The goal for today it to set up the advection experiment to run through the summer until the end of October. First Carlos, Dennis and Ari headed out into the field to collect some ground truth data for a Landsat overpass at about 10:30 this morning. We sampled the "skin" temperature of the alfalfa for 16 Landsat 8 pixels. To get to a specific pixel, we used Google Earth on the phone to navigate to the centroid as close as possible. Then within each pixel, 3 temperature samples were taken. Among the 16 pixels, 2 were discarded as we walked pass them. The location of the additional towers were marked as we did the overpass sampling. 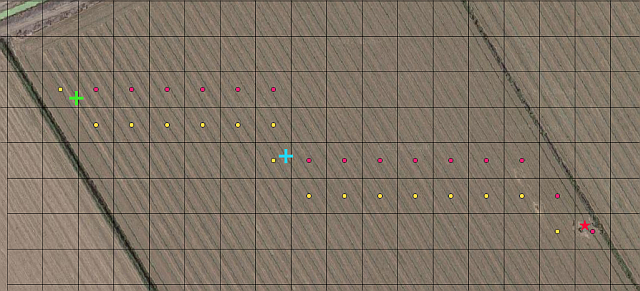 Overpass sampling diagram with points sampled on 04/25 (yellow). The red points are extra points that could be sampled if time permits. This map also includes the location of the main tower (star), the bouncer tower (blue cross), and the edgy tower (green cross). Daphne and I started at the main tower. Daphne collected met, camera and flux data and then updated the CR1000 program to add two Hygrovue RH/T sensors to be collected at 10sec intervals. Meanwhile, I added a telescoping mast made from two 10ft lengths of metal conduit to the scaffolding with cross-over fittings for upper sensors. A third cross-over fitting is on the upper railing but it still needs some padding to fit the smaller railing diameter. I also added a cross arm with another cross-over fitting for a lower sonic. The sonic data is collected at 20Hz by a CR1000 sn 23865 mounted on the railing. Upper sensors at 6.08m agl Sonic sn 152605, 327deg true N (heading maintained by matching markings on inner and outer poles) RH/T HygroVue sn E3452 in an aspirated solar shield. Lower sensors at 2.42m agl Sonic sn 152608 at 2deg true N RH/T HygroVue sn E3514 in an aspirated solar shield mounted to the existing eddy post. In the evening before we left the site we swapped out the rotting plywood of the upper boardwalk. We also noticed that the CR1000 met data logger had a few skipped scans. Daphne downloaded the IRT and FD data. She also adjusted the eddy clock by +1 min in the morning. We spent the rest of the day installing two upwind towers that are nearly identical in structure and sensors (see below). At about 12:30 we started on to the first of the two upwind towers – the Bouncer Tower. This tower is about 257m along a 285deg heading from the main tower. About 3pm we started on the second tower – the Edge (Edgy) Tower. This tower is an additional 183m (440m total) upwind along the 285deg heading and near the edge of our field and the next alfalfa field to the west. Fields further upwind are being tilled in preparation for planting corn. Each of the upwind towers have a tripod supporting a telescoping post in a ground screw anchor and post mounted solar panels. The solar panels are connected to the tower by armored cable running in a shallow trench. Each tower has three packages of sensors: upper, lower and ground. At the Bouncer tower the solar panels and ground sensors are deployed south of the tower and at the Edge Tower the solar panels and ground sensors are north of the tower. Putting these to the south greatly disturbed the ground that the net radiometer most directly sees but the ground sensors to the north might catch some shadows from the tower. The upper sonic and IRGA are recorded at 20Hz by the LI-7550. The lower sonic is recorded at 20Hz by a CR6 along with the two RH/T sensors recorded at 10sec intervals in a slow sequence. The Rnet and all the ground sensors are sampled at 10sec and recorded as 30min averages by a CR23X. IRGA readings: Main Tower: 418ppm CO2, 364mmol/m3 H2O, 23.8C, 101.7kPa, 99SS Bouncer Tower: 416ppm CO2, 500mmol/m3 H2O, 25.9C, 101.6kPa, 102SS Edge Tower: 420ppm CO2, 440mmol/m3 H2O, 26.8C, 101.4kPa, 100SS Bouncer Tower: Upper Sensors at 3.96m agl Sonic sn 152606 at 17deg true N RH/T HMP45 sn D4420029 in aspirated solar shield Licor 7500RS sn 75H-0128 and 7550 sn AIU-2312 from AMP Rnet-LITE sn 990353 at 3.34m agl on an arm ?m to the south Lower sensors at 2.46m agl CR6 sn 2114 Sonic sn 153804 at 354deg true N RH/T HMP155 sn T2930114 in aspirated homemade solar shield mounted to central post Ground Sensors: 23x sn 2300 Soil moisture CS655 sn 17131 at -10cm Soil moisture ML3 sn ??? at -10cm SHF Hukseflux sn 003072 at -10cm SHF Peltier sn PC1 at -10cm SHF Peltier sn PC2 at -10cm Two soil temperature TCs at -5cm Two soil temperature TCs at -10cm Solar Power: Solar panel sn 020854E-6-03-02-06825 75W Solar panel sn 020854E-6-03-02-06832 75W Solar charge controller sn 03220377 Battery bank sn BB-BA-bncr two brand new grp27 deep cycle marine Duracell 90Ahr SLI27MDC 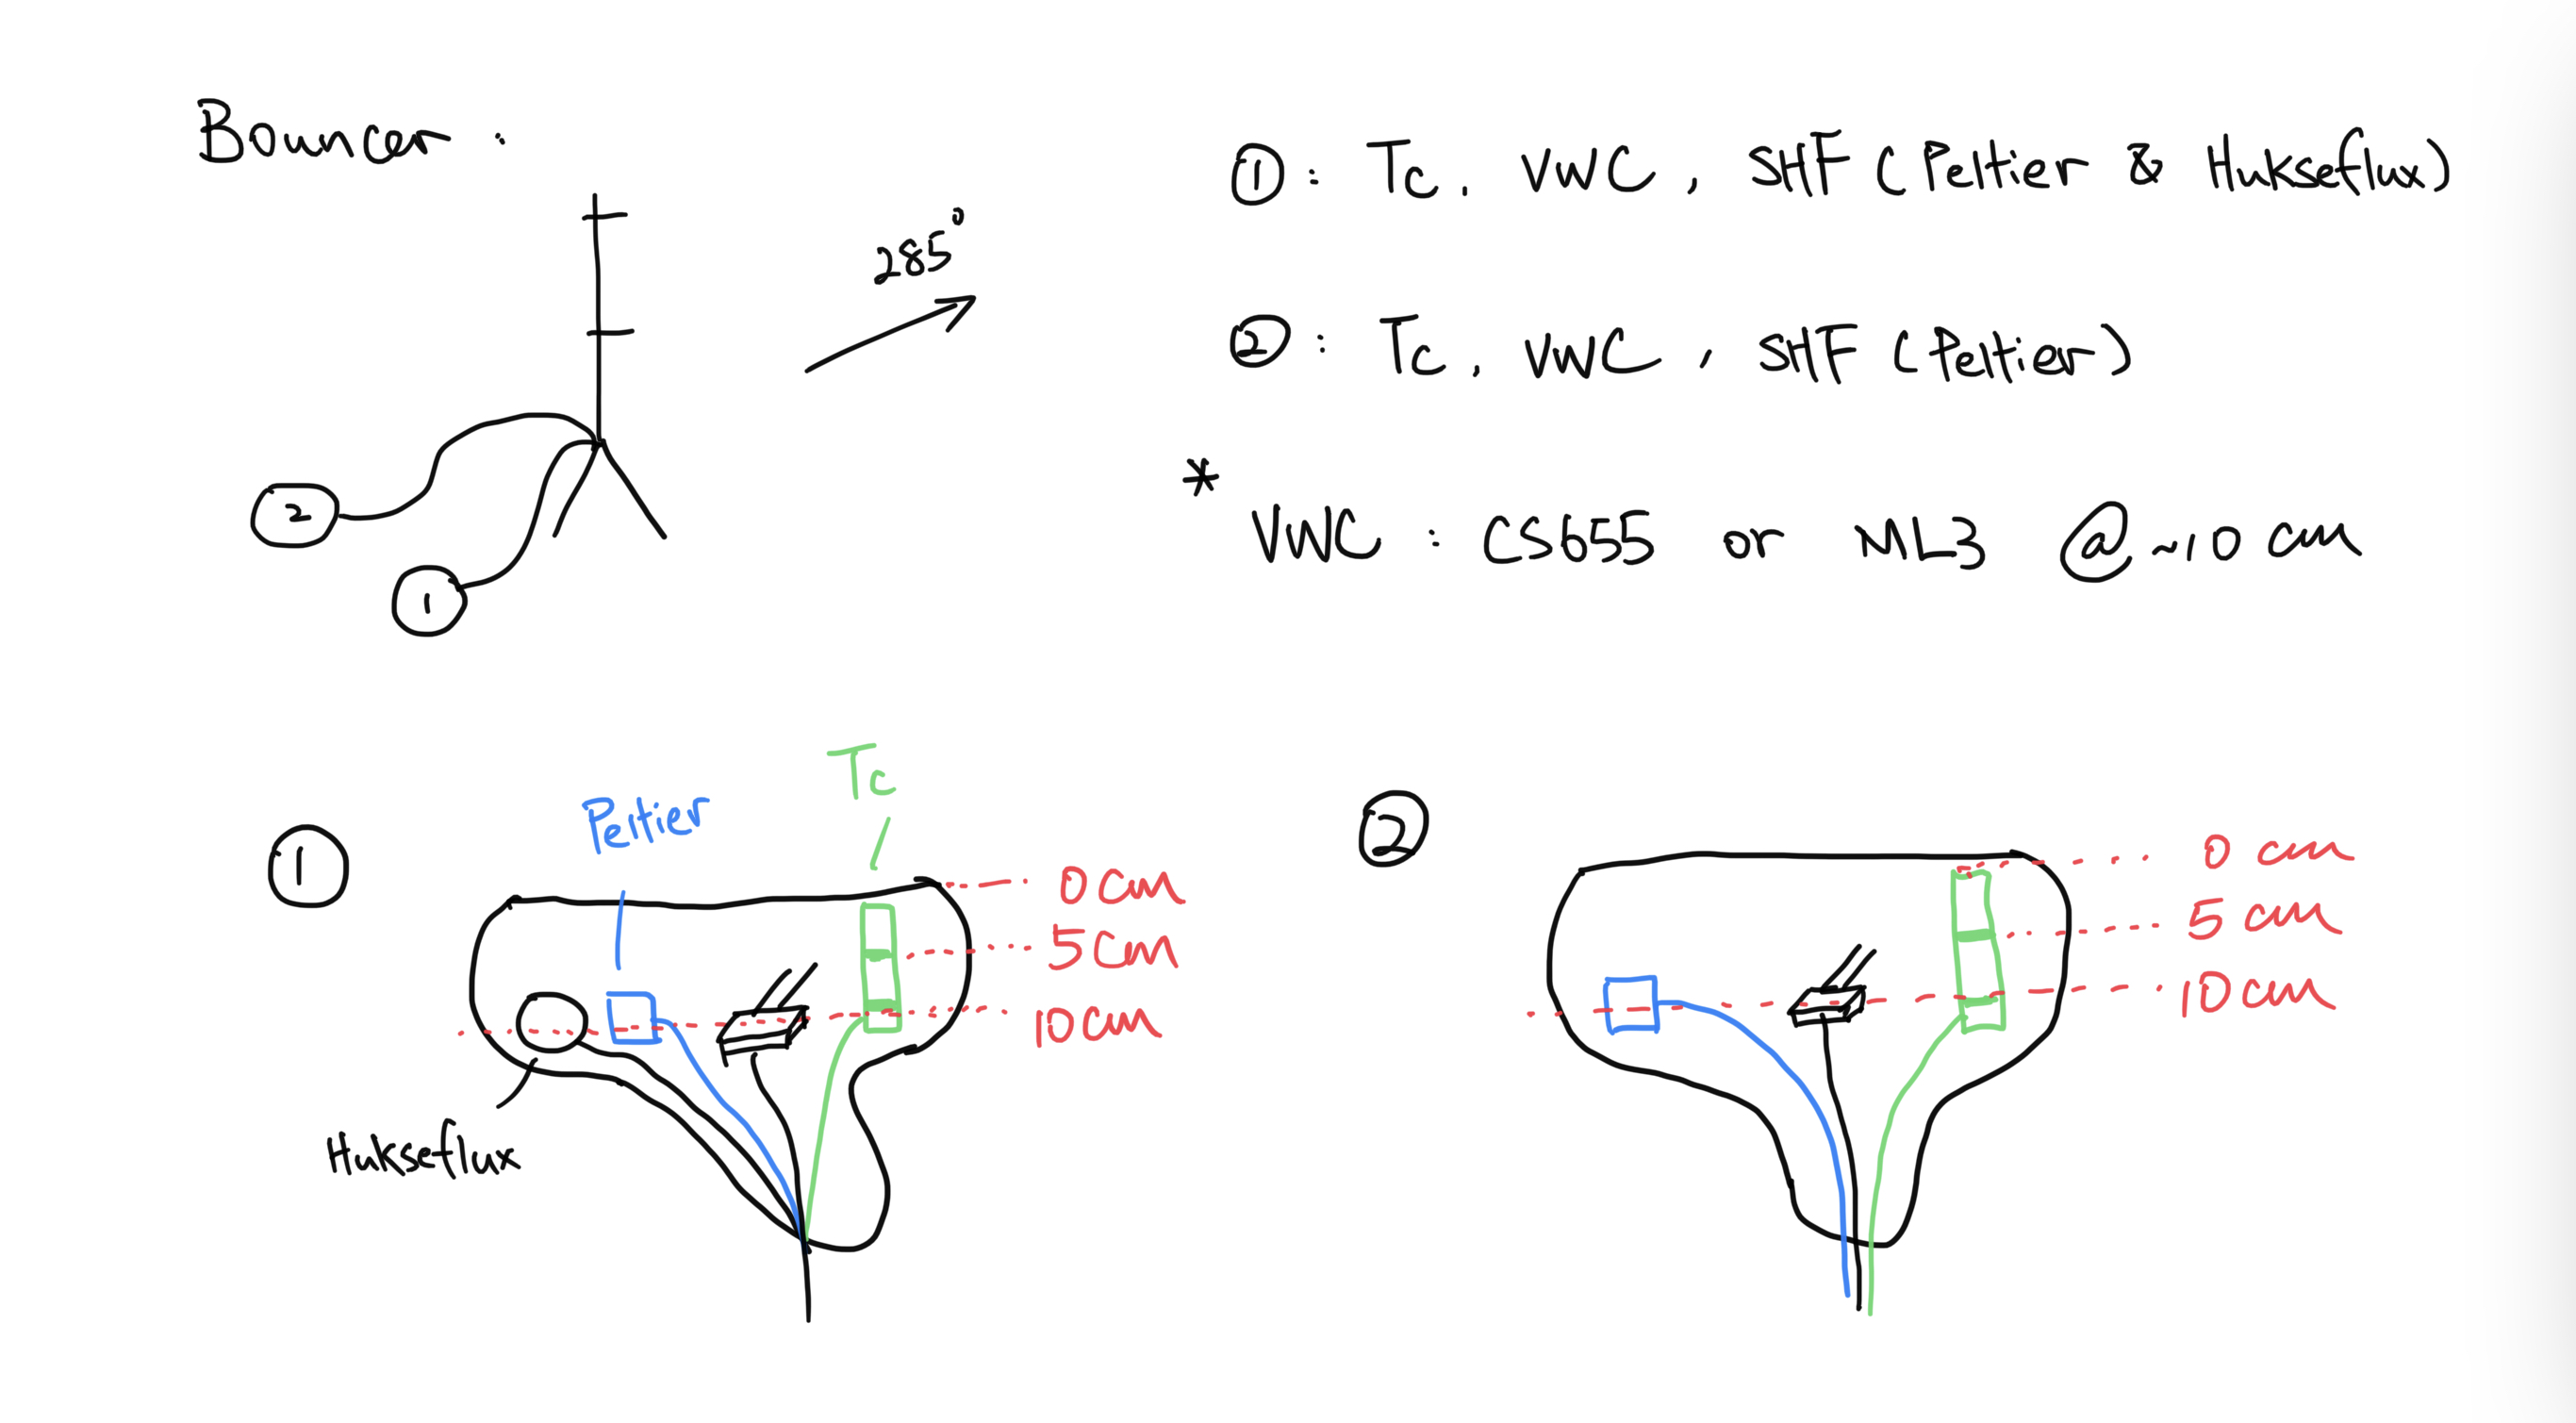 Edge Tower Upper Sensors at 3.96m agl Sonic sn 152601 at 70deg true N RH/T HMP45 sn D4420028 in aspirated solar shield Licor 7500A sn 0042 and 7550 sn AIU-0674 from AMP Rnet-LITE sn 990350 at 3.34m agl on an arm ?m to the south Lower sensors at 2.46m agl CR6 sn 2115 Sonic sn 152603 at 8deg true N RH/T HMP45 sn T1020004 in aspirated homemade solar shield mounted to central post Ground Sensors: CR23x sn 2303 Soil moisture CS655 sn 17130 at -10cm Soil moisture ML3 sn ??? at -10cm SHF Hukseflux sn 003073 at -10cm SHF Peltier sn PC3 at -10cm SHF Peltier sn PC4 at -10cm Two soil temperature TCs at -5cm Two soil temperature TCs at -10cm Solar Power: Solar panel sn 020854E-6-03-02-06862 75W Solar panel sn 024398E-1-26-04-99974 75W Solar charge controller sn 19391162 Battery bank sn BB-BA-edge two brand new grp27 deep cycle marine Duracell 90Ahr SLI27MDC 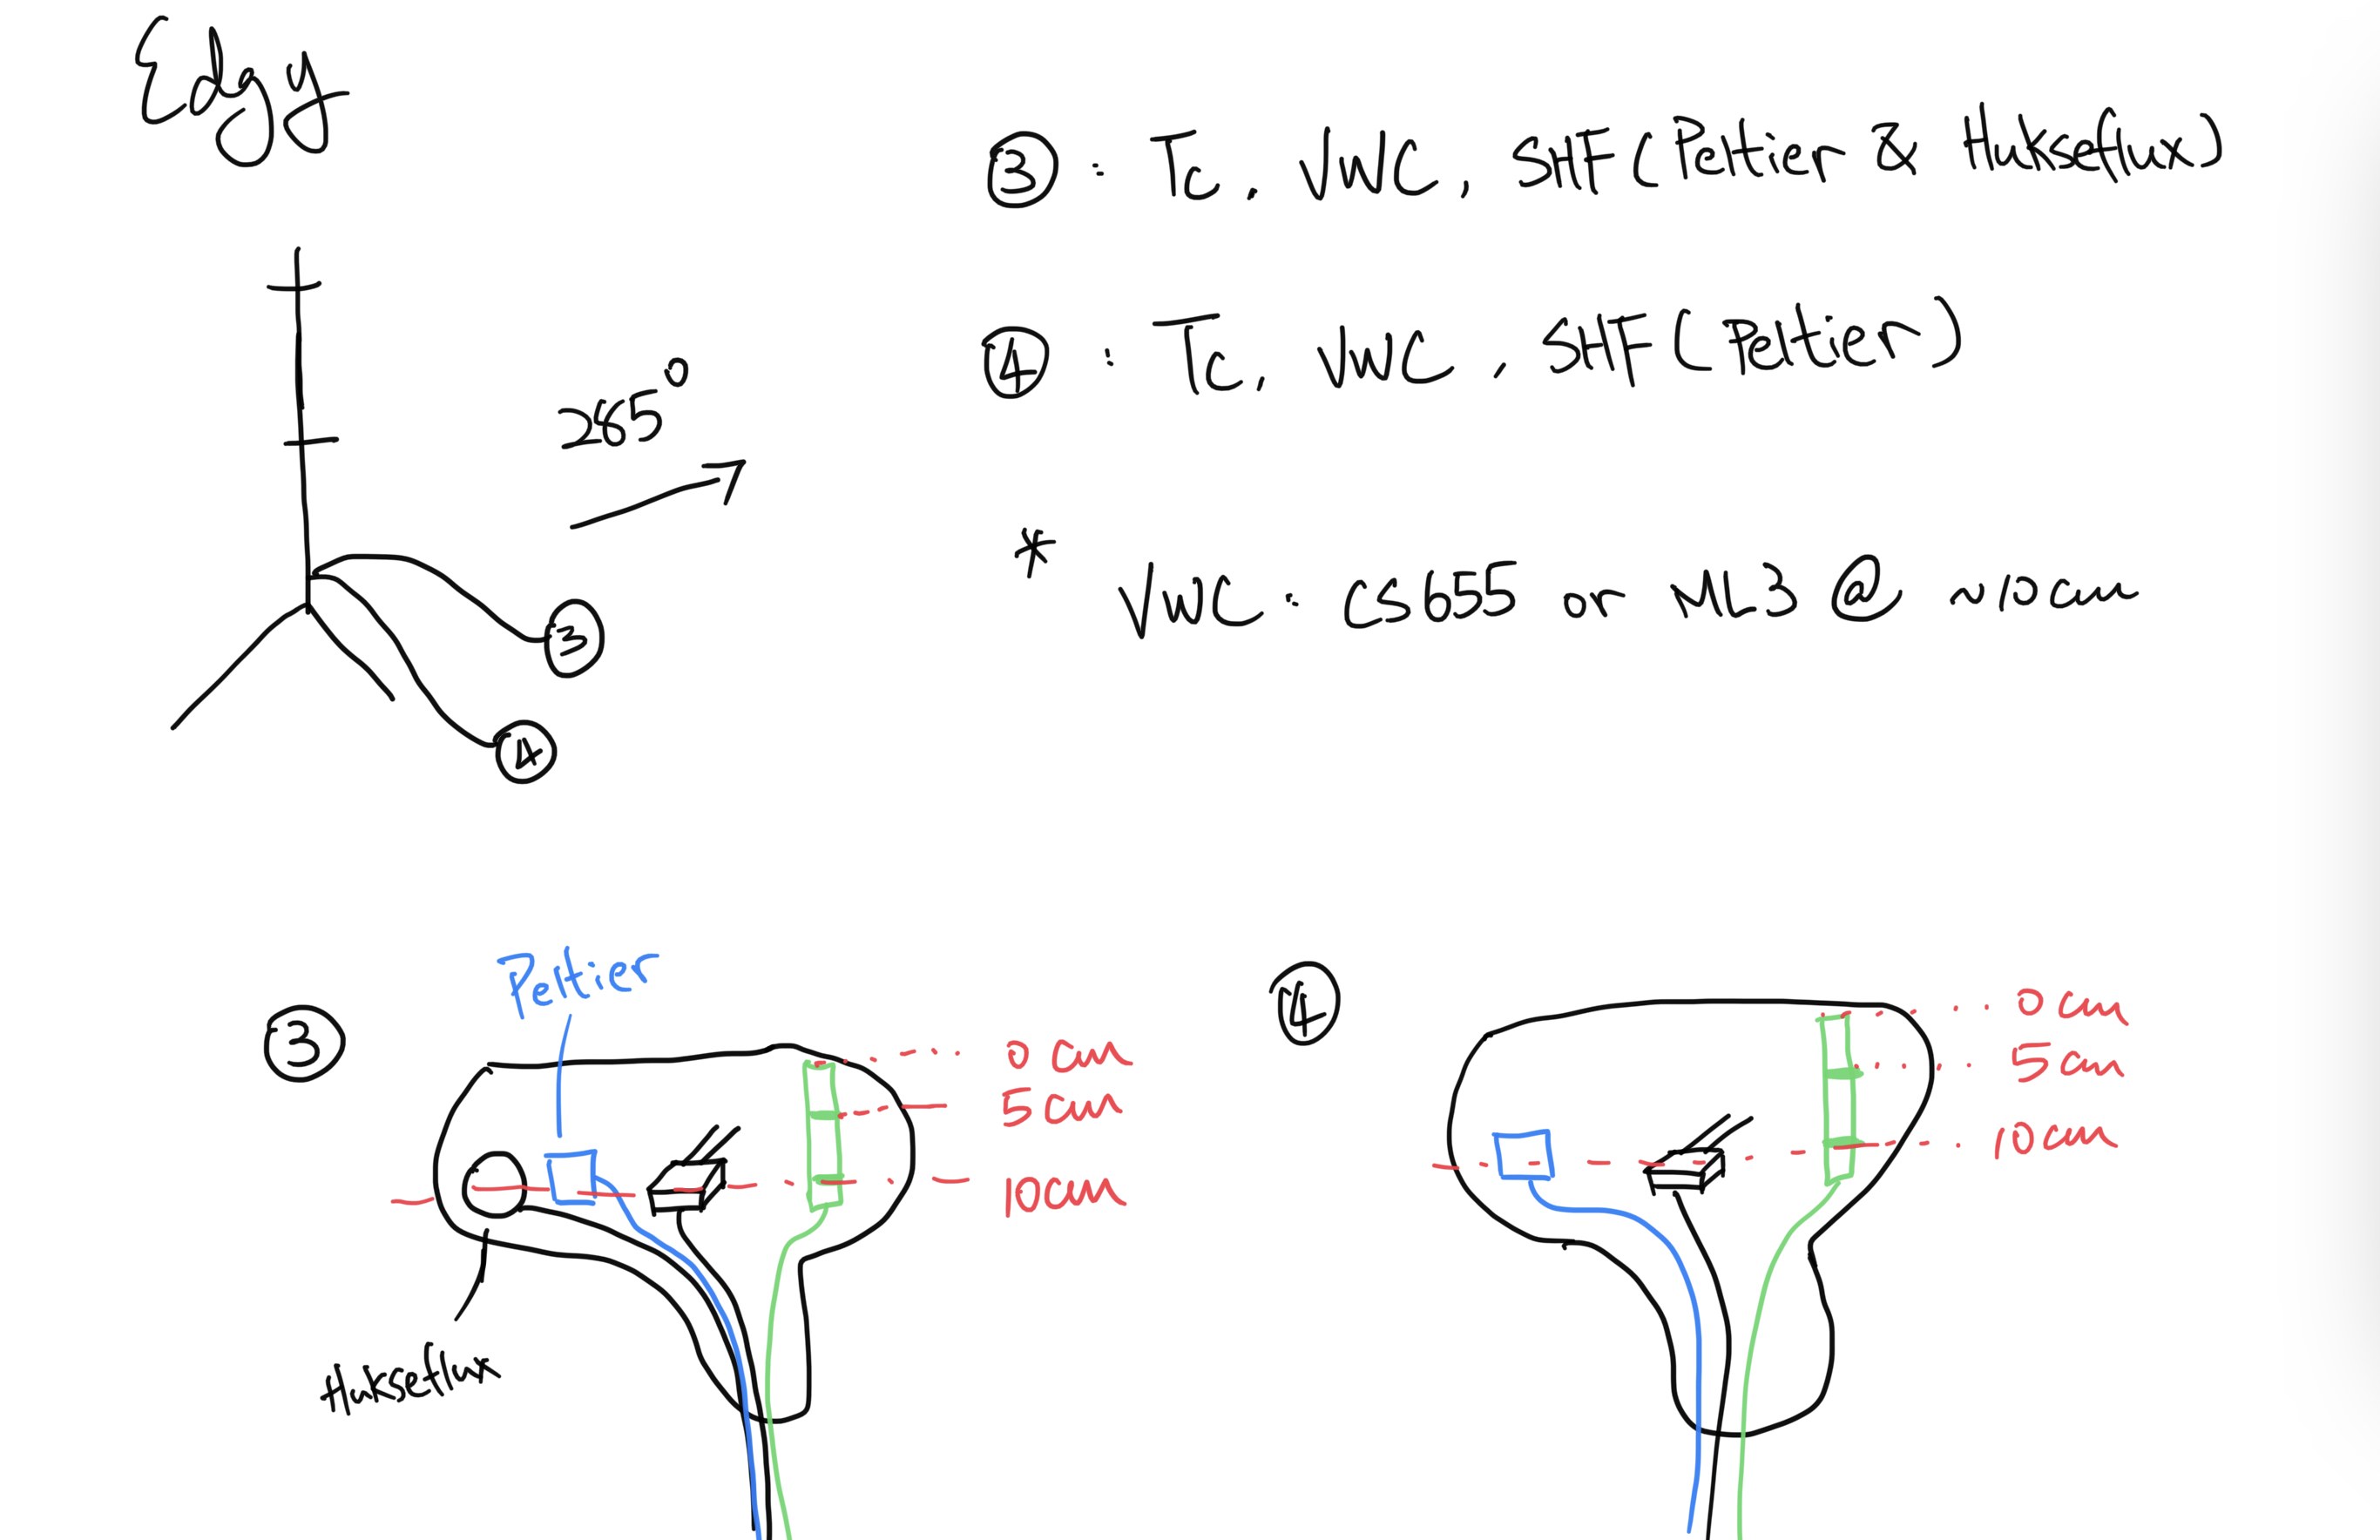 We headed home at 17:45 PDT. |
Next Mowing: 2022-05-04
Veg Height (cm): Tape measure from ground to top of plant
35, 30, 25, 49, 40, 37, 42, 54, 43, 31, avg = 38.6, stdev = 8.88
7 photos found
20220425BA_Edge.jpg ( 2022-04-25 17:10:10 ) Full size: 1440x1920
Carlos at the completed Edge Tower
20220425BA_Bouncer.jpg ( 2022-04-25 14:57:33 ) Full size: 1920x1440
Bouncer Tower. Alfalfa all around the tower has been trampled by our setup process. Unfortunately this is also the alfalfa that the Rnet sees.
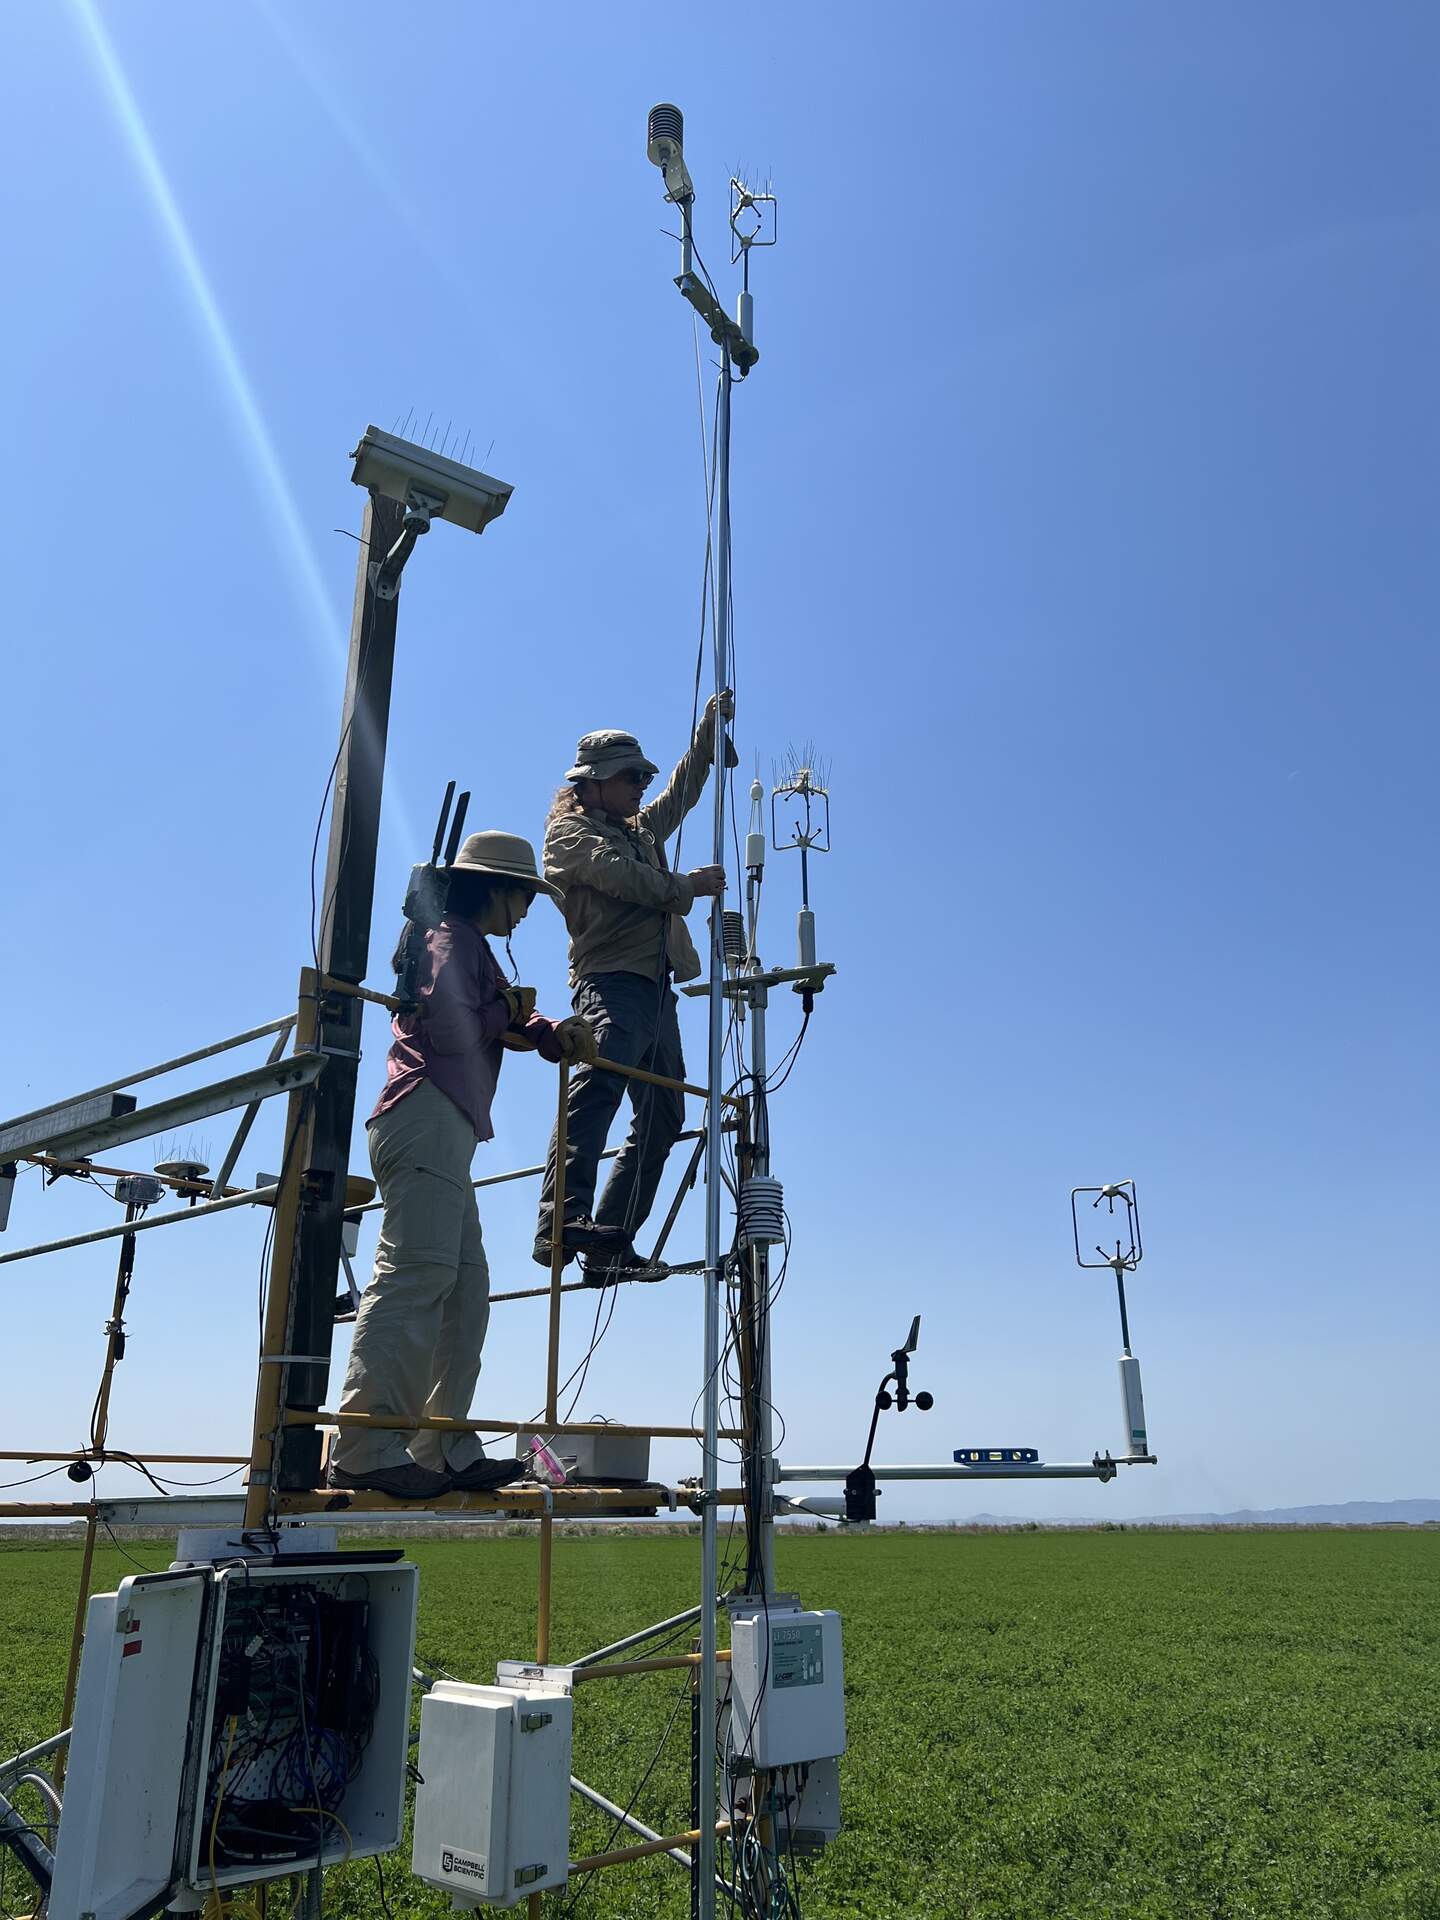
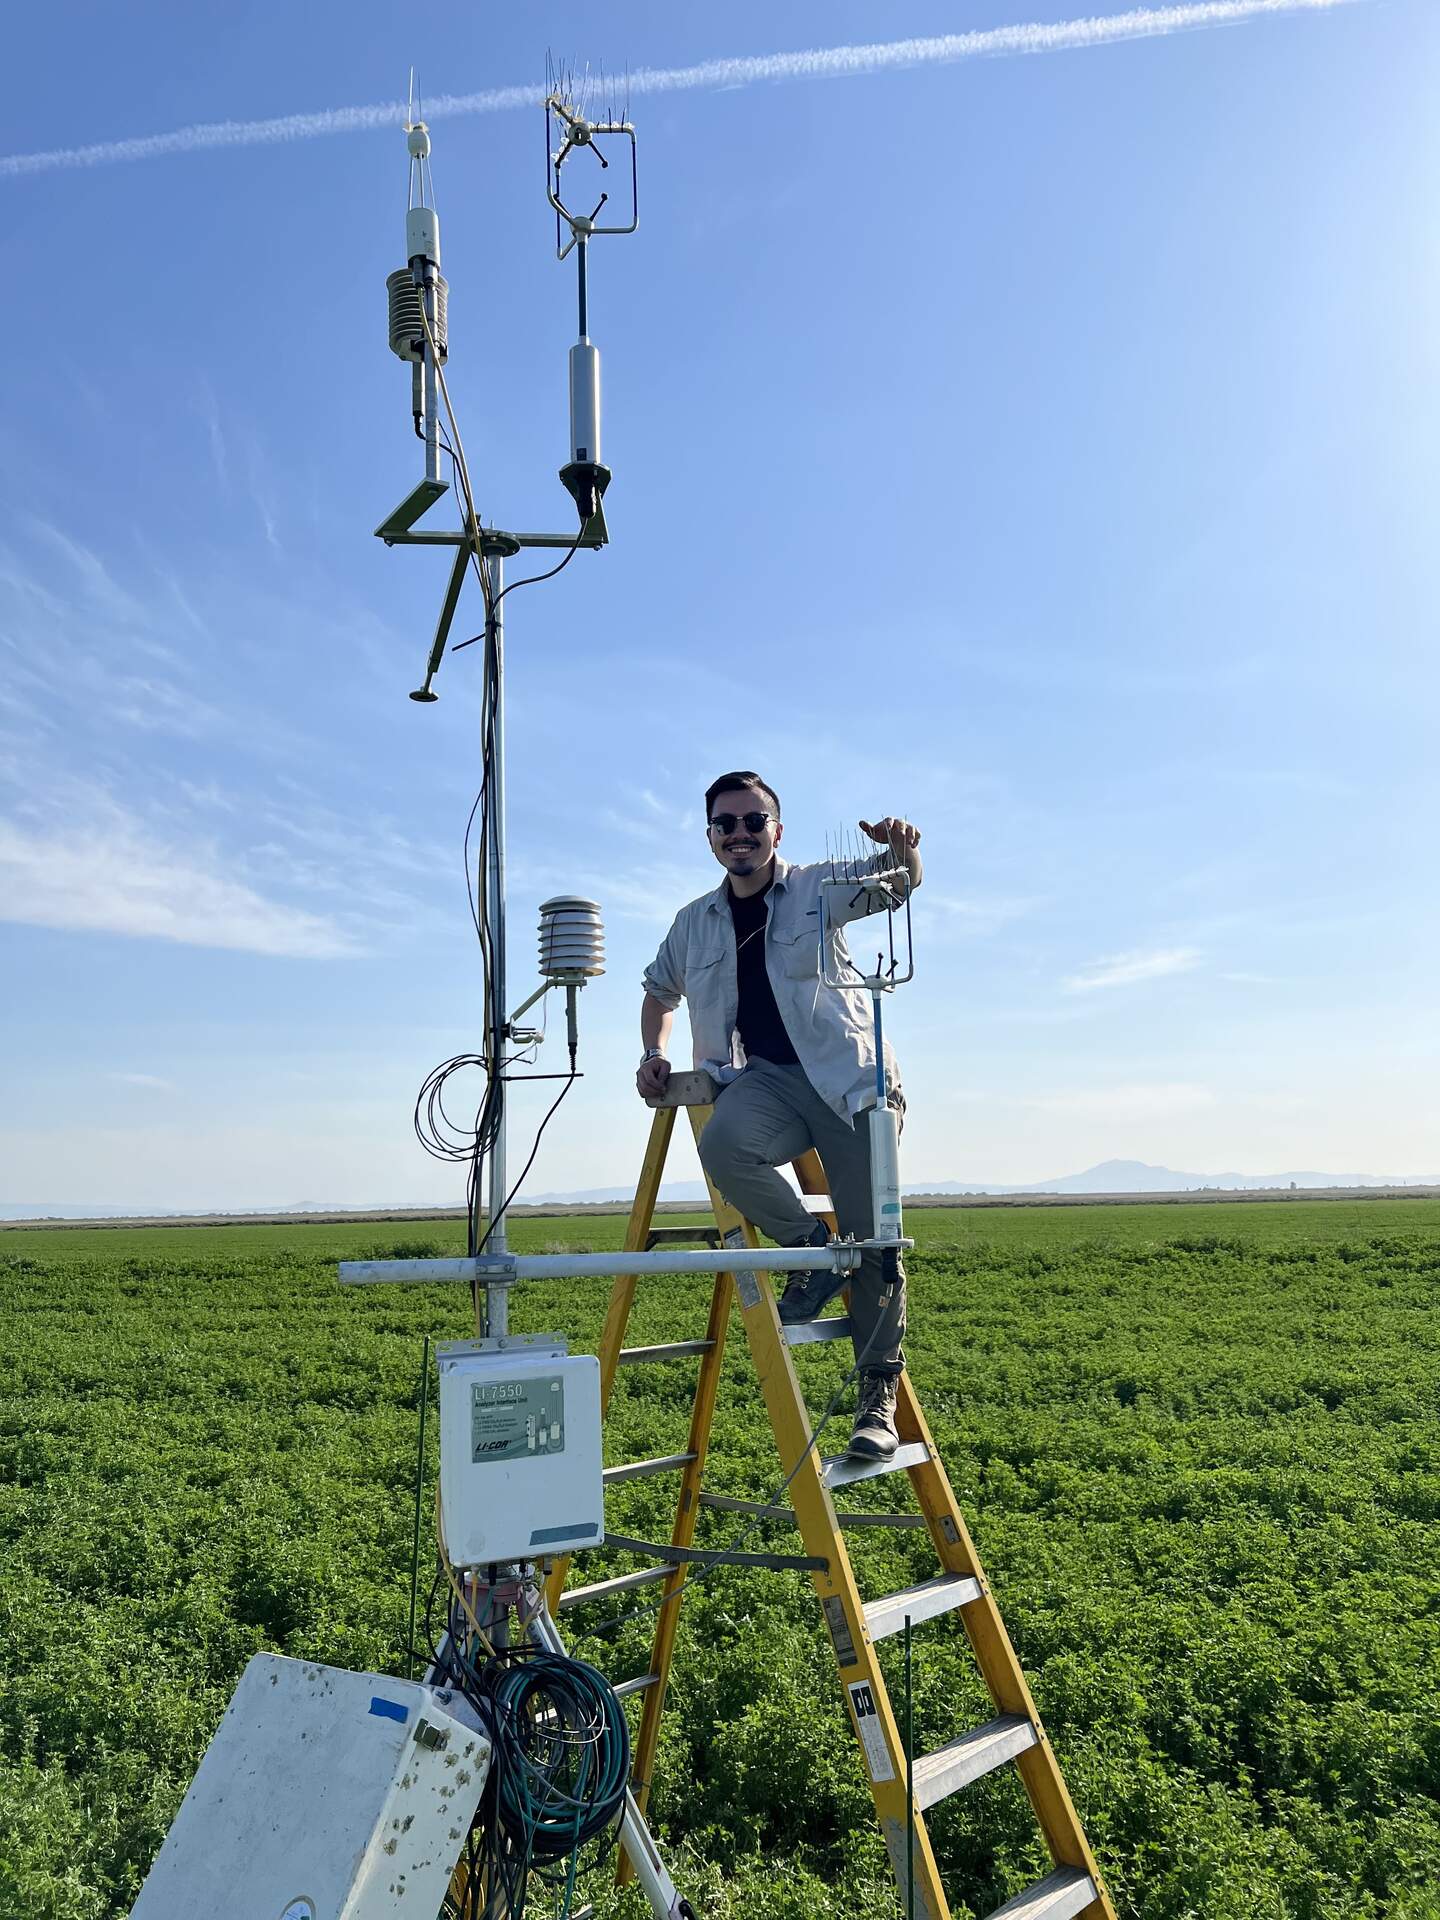
20220425BA_ExtraSonics.jpg ( 2022-04-25 11:52:39 ) Full size: 1440x1920
Daphne and Joe on the main tower setting up the extra sonics for the advection experiment

20220425BA_Irt.jpg ( 2022-04-25 11:42:11 ) Full size: 1920x1440
Ariane and Dennis taking IRT measurements of alfalfa around the same time as the Landsat 8 overpass
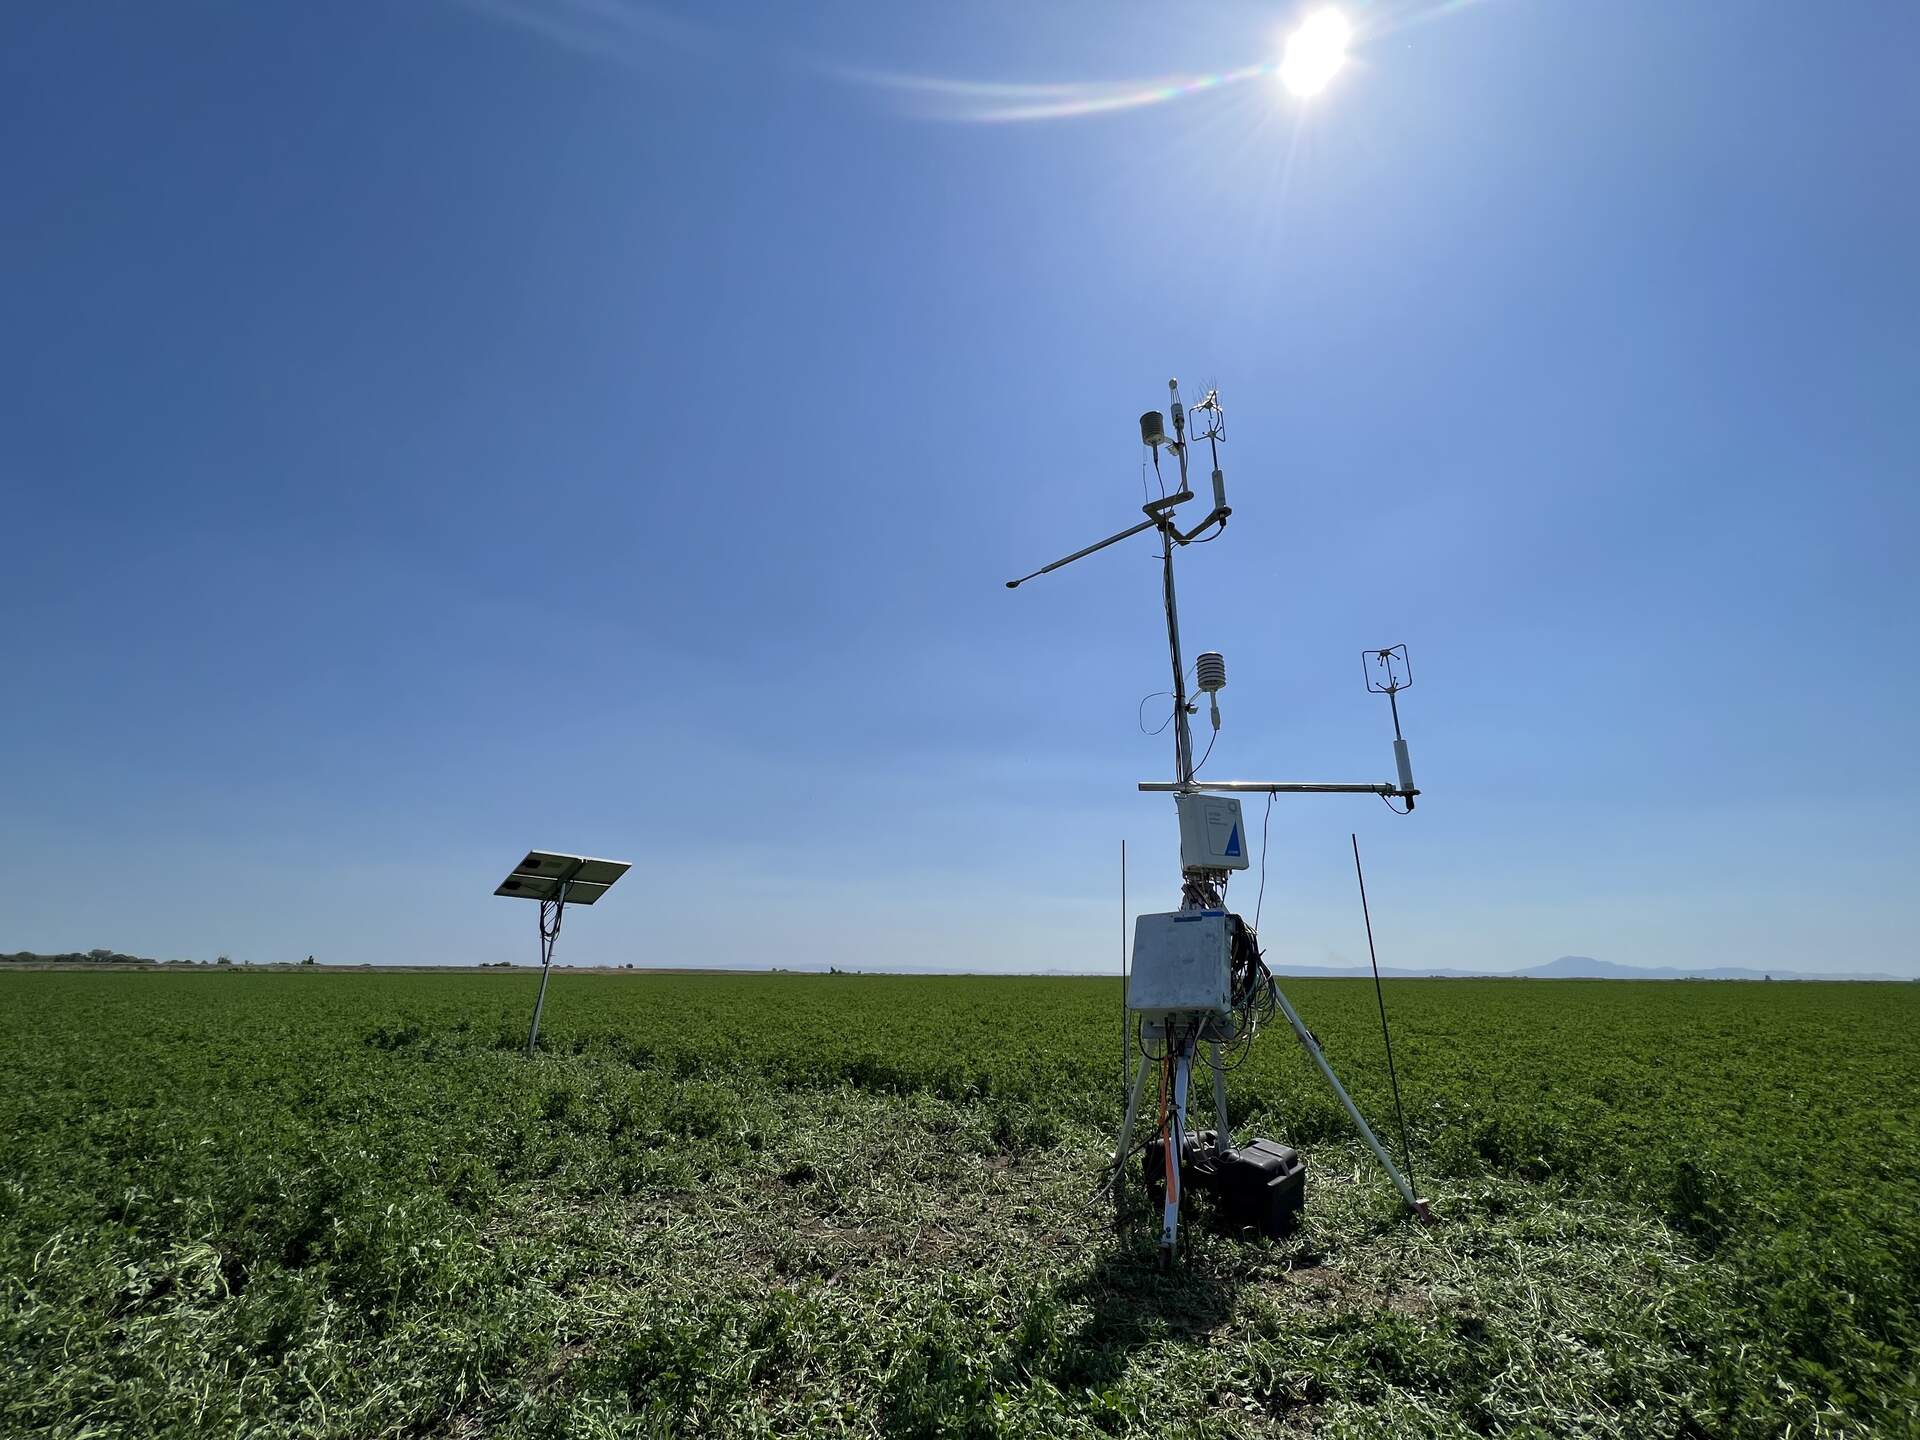
bouldinalfalfa_2022_04_25_104505.jpg ( 2022-04-25 11:46:04 ) Full size: 1296x960
Super advection study set up.

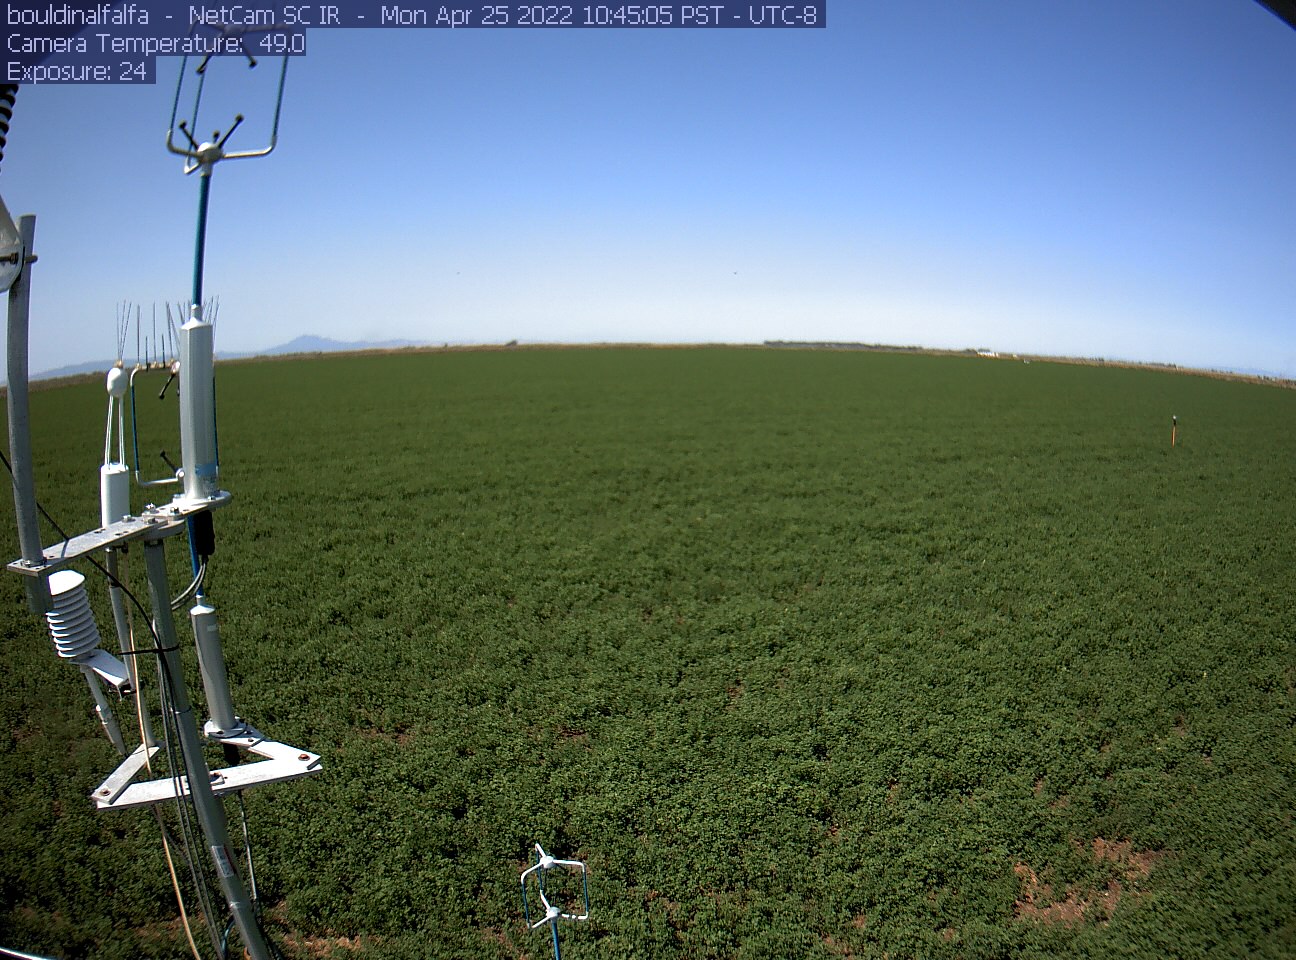
bouldinalfalfa_2022_04_25_111506.jpg ( 2022-04-25 12:16:04 ) Full size: 1296x960
Super advection study set up
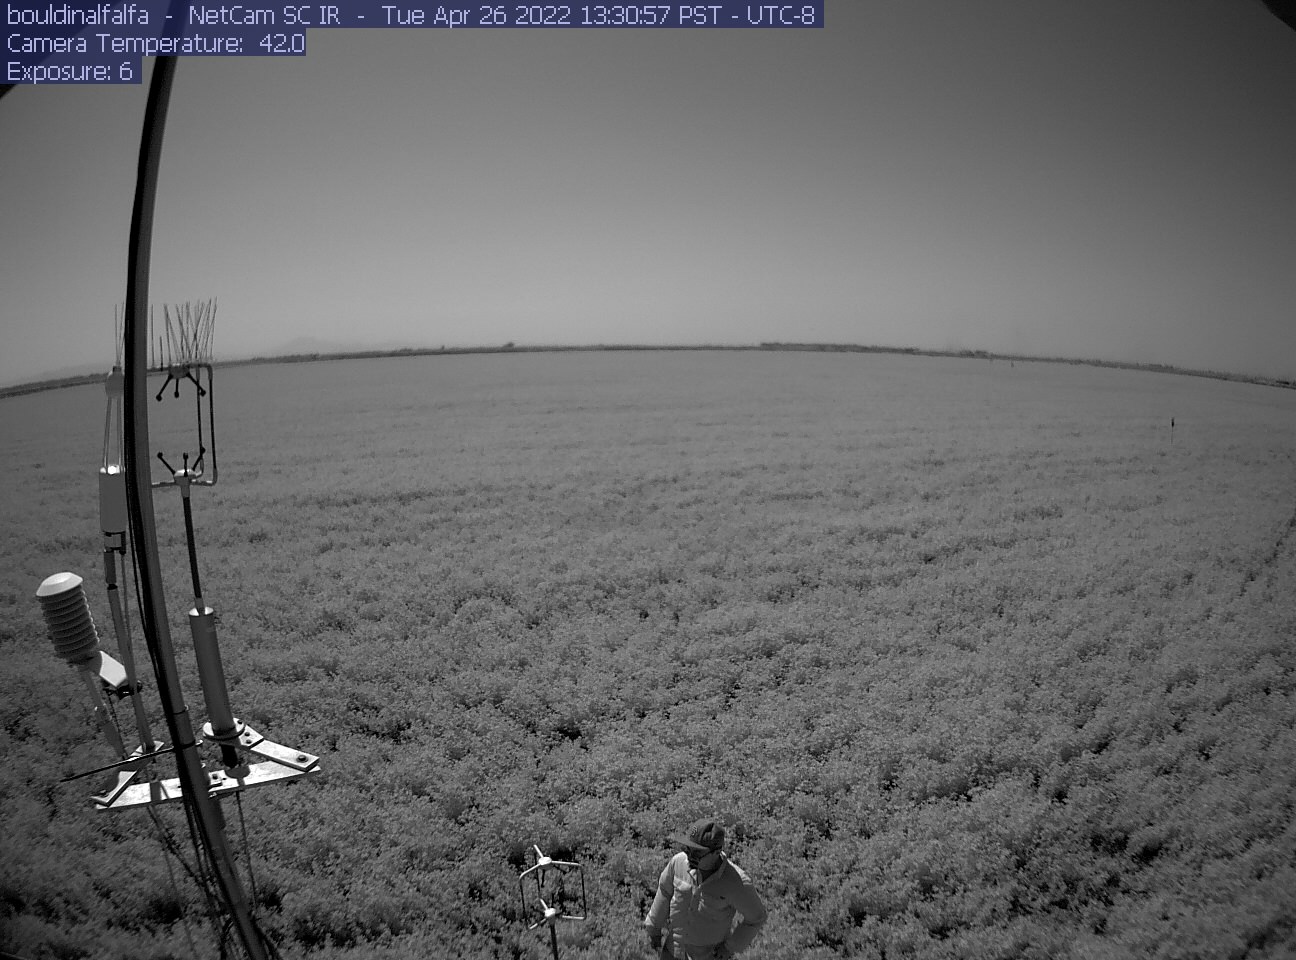
bouldinalfalfa_IR_2022_04_26_133057.jpg ( 2022-04-26 14:33:38 ) Full size: 1296x960
Carlos in IR
7 sets found
5 BA_flux graphs found
21 BA_met graphs found
6 BA_arable graphs found
Can't check TATWBABCSB_cam
Can't check MBSWEEWPBCBA
2 BA_processed graphs found
No data found for BA_adex.