Field Notes
<--2022-02-23 10:45:00 | 2022-03-24 11:10:00-->Other sites visited today: Tonzi | West Pond
Phenocam link: Searching...
Vaira: 2022-03-10 11:30:00 (DOY 69)
Author: Joe Verfaillie
Others: Dennis
Summary: Trees putting on leaves, popcorn flowers, swapped 7500, removed cal kit
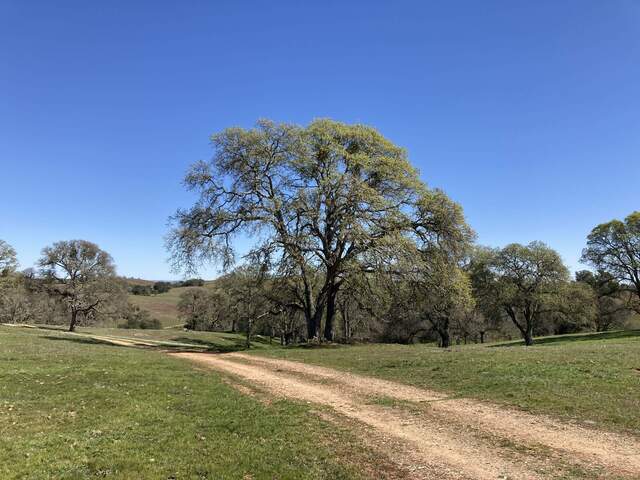
| Vaira 2022-03-10 Dennis and I arrived at about 11:30 PST. It was clear, sunny and mild with a gusty wind. The trees have begun to put on leaves in earnest. The grass looks a little thicker but not any taller. I also noticed a brown patch – no rain since early January, low RH today ~16%. The ground surface is dry but the water hole was still mostly full. The white popcorn flowers are beginning to appear in large patches. Dennis measured the well, did spectral measurements and veg height. I collected the met, flux, image and FD data. I swapped the IRGA for calibration: sn 75H-2182 came off and sn 75H-2667 went on. I updated the pressure coefficients and restarted the box. 2182 read: 419.2ppm CO2, 160.8mmol/m3 H2O, 99.9kpa, 18.4C, 99.5SS 2667 read: 409.8ppm CO2, 239.6mmol/m3 H2O, 99.9kPa, 18.3C, 102.0SS I collected the data from the cal kit CR1000 and then removed the cal kit system from the radiometer boom. The following equipment was moved to Tonzi Tower. CR1000 sn 23865 CNR4 sn 120788 PAR sn 212225 NDVI in sn 1049 NDVI out sn 1050 HMP155 sn T2930114 We left at about 12:15 for Tonzi |
Field Data
No tank data
Well Depth
| Date | Location | Depth (feet) |
|---|---|---|
| 2022-03-10 | VR_well | 52.9 |
| 2022-03-10 | TZ_floor | 26.8 |
| 2022-03-10 | TZ_road | 33.8 |
| 2022-03-10 | TZ_tower | 29.2 |
mode = both
Moisture Point Probes TZ
Array
(
[0] => Tower_1
[1] => Floor_South_1
[2] => Soil_Transect_4_1
[3] => Soil_Transect_3_1
[4] => Soil_Transect_2_1
[5] => Soil_Transect_1_1
[6] => SoilCO2_West_A_1
[7] => SoilCO2_West_C_1
[8] => Tower_2
[9] => Floor_South_2
[10] => Soil_Transect_4_2
[11] => Soil_Transect_3_2
[12] => Soil_Transect_2_2
[13] => Soil_Transect_1_2
[14] => SoilCO2_West_A_2
[15] => SoilCO2_West_C_2
[16] => Tower_3
[17] => Floor_South_3
[18] => Soil_Transect_4_3
[19] => Soil_Transect_3_3
[20] => Soil_Transect_2_3
[21] => Soil_Transect_1_3
[22] => SoilCO2_West_A_3
[23] => SoilCO2_West_C_3
[24] => Tower_4
[25] => Soil_Transect_4_4
[26] => Soil_Transect_3_4
[27] => Soil_Transect_2_4
[28] => Soil_Transect_1_4
[29] => SoilCO2_West_A_4
[30] => SoilCO2_West_C_4
)
| Date | DOY | Rep | Depth | Tower_1 |
Floor_South_1 |
Soil_Transect_4_1 |
Soil_Transect_3_1 |
Soil_Transect_2_1 |
Soil_Transect_1_1 |
SoilCO2_West_A_1 |
SoilCO2_West_C_1 |
Tower_2 |
Floor_South_2 |
Soil_Transect_4_2 |
Soil_Transect_3_2 |
Soil_Transect_2_2 |
Soil_Transect_1_2 |
SoilCO2_West_A_2 |
SoilCO2_West_C_2 |
Tower_3 |
Floor_South_3 |
Soil_Transect_4_3 |
Soil_Transect_3_3 |
Soil_Transect_2_3 |
Soil_Transect_1_3 |
SoilCO2_West_A_3 |
SoilCO2_West_C_3 |
Tower_4 |
Soil_Transect_4_4 |
Soil_Transect_3_4 |
Soil_Transect_2_4 |
Soil_Transect_1_4 |
SoilCO2_West_A_4 |
SoilCO2_West_C_4 |
Avg | Spacial Count |
Measurement Count |
|---|---|---|---|---|---|---|---|---|---|---|---|---|---|---|---|---|---|---|---|---|---|---|---|---|---|---|---|---|---|---|---|---|---|---|---|---|---|
| 2022-03-10 | 69 | 0 | nan | 20.9 | 9.7 | 10.3 | 14.4 | 12.7 | 12.1 | 18.5 | 10.6 | 26.8 | 16.4 | 12.4 | 23.1 | 25.8 | 11.2 | 11.1 | 19.1 | 27.4 | 28.2 | 16.8 | 23.2 | 28.8 | 27.1 | 39.6 | 24.6 | 39.7 | 21.6 | 32.8 | 44 | 26.5 | 52.6 | 37.1 | |||
| 2022-03-10 | 69 | 1 | nan | 20.3 | 10.6 | 10.6 | 14.4 | 12.4 | 12.1 | 10 | 25.8 | 15.2 | 13 | 22.8 | 25.2 | 11.5 | 18.8 | 26.2 | 27.9 | 16.2 | 23.7 | 29 | 27.9 | 25.7 | 38.5 | 21.3 | 32.2 | 43.7 | 26.8 | 37.4 | |||||||
| 2022-03-10 | 69 | 2 | nan | 20 | 10.9 | 10.6 | 14.7 | 12.4 | 12.1 | 11.2 | 26.1 | 13.9 | 12.7 | 22.8 | 24.6 | 11.5 | 19.1 | 26.8 | 28.5 | 17.9 | 24.3 | 29 | 27.1 | 26 | 39.1 | 21.3 | 32.2 | 43.1 | 26.8 | 38.3 | |||||||
| 2022-03-10 | 69 | Avg | 0-15cm | 0 | 0 | ||||||||||||||||||||||||||||||||
| 2022-03-10 | 69 | Avg | 15-30cm | 0 | 0 | ||||||||||||||||||||||||||||||||
| 2022-03-10 | 69 | Avg | 30-45cm | 0 | 0 | ||||||||||||||||||||||||||||||||
| 2022-03-10 | 69 | Avg | 45-60cm | 0 | 0 |
No VR Moisture Point data found
No TZ grass heigth found
Grass Height VR 10
| Date | Height reps (cm) | Location | Average | Samp | STDEV | |||||||||
|---|---|---|---|---|---|---|---|---|---|---|---|---|---|---|
| 2022-03-10 | 6 | 4 | 6 | 4 | 5 | 5 | 4 | 6 | 4 | 7 | GH_ALL | 5.1 | 10 | 1.04 |
No VR Tree DBH found
No water potential data found
No VR Grass Biomass data found
No VR OakLeaves Biomass data found
No VR PineNeedles Biomass data found
1 photos found

20220310VR_Leaves.jpg ( 2022-03-10 12:21:19 ) Full size: 1920x1440
The trees have started putting in leaves in earnest.
9 sets found
16 VR_met graphs found
2 VR_flux graphs found
2 VR_soilco2 graphs found
2 VR_pond graphs found
Can't check TZVR_mixed
3 VR_fd graphs found
4 VR_processed graphs found
4 VR_arable graphs found
No data found for VR_soilvue.

